

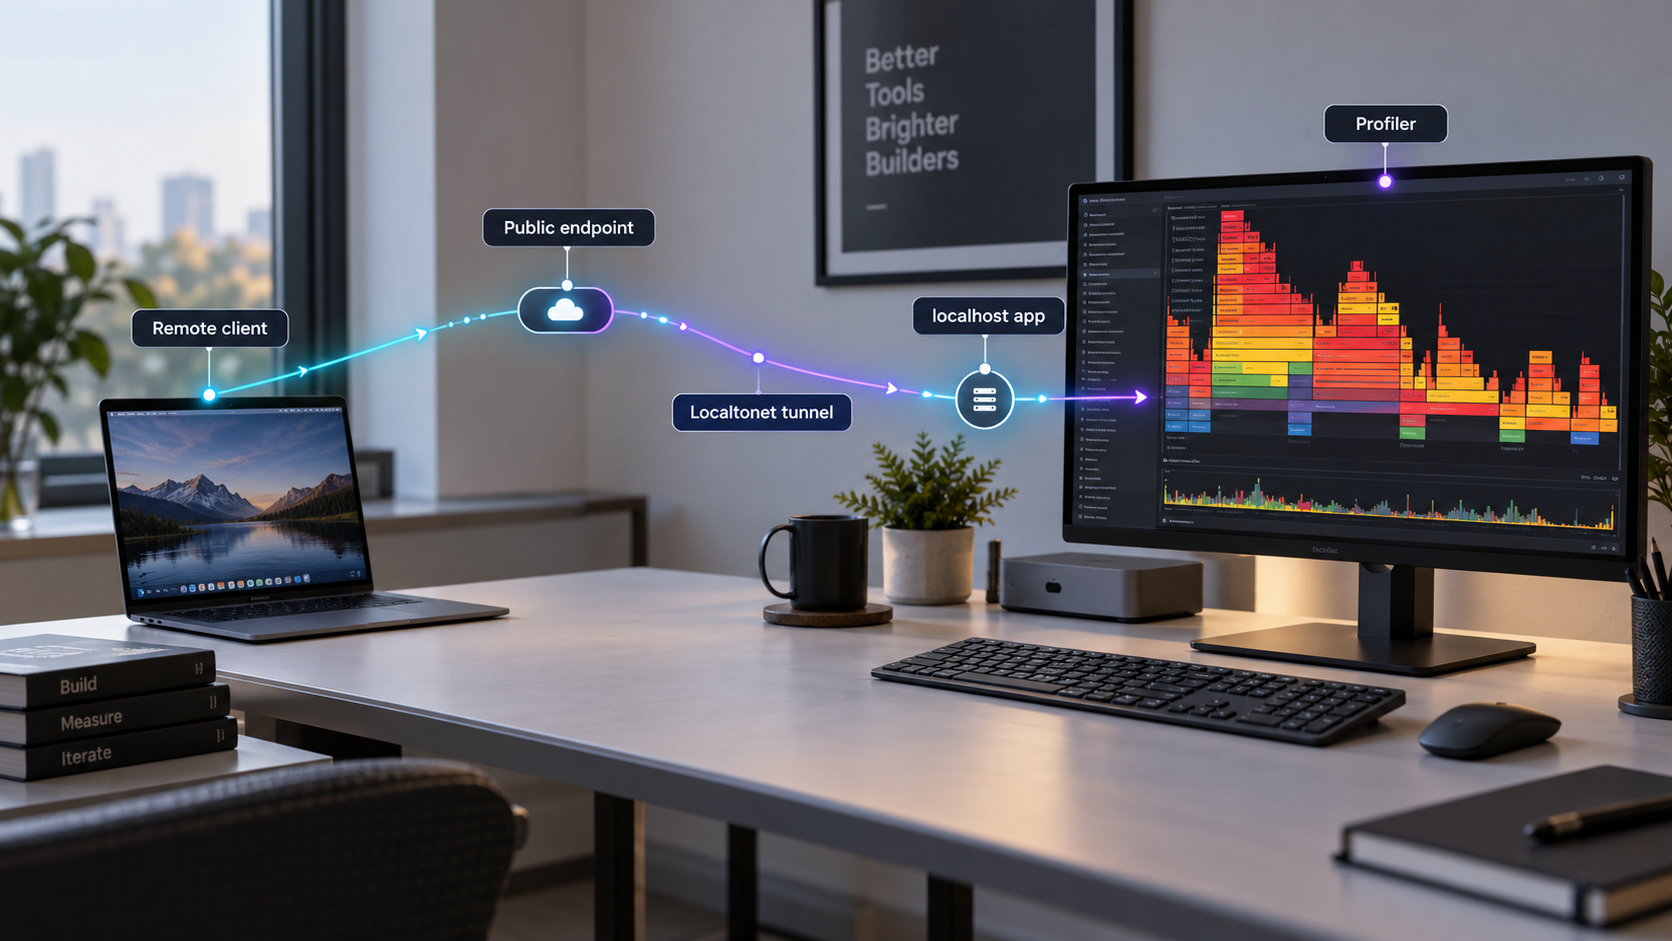
Find the code paths that consume CPU or retain memory under realistic remote traffic
A slow remote request does not automatically mean the tunnel is slow. The application may be saturating a CPU core, allocating excessively, waiting on locks, pausing for garbage collection, or holding objects longer than expected. In this guide, we build a controlled profiling workflow that compares direct localhost traffic with requests sent through a Localtonet HTTP or TCP tunnel. We also explain how to read CPU and memory flamegraphs, verify suspected bottlenecks, and keep profiler interfaces and diagnostic files private.
📋 What's in this guide
Why profile an application under remote traffic?
Logs answer questions about events: which route ran, whether an exception occurred, which status code was returned, or how long an operation took. Metrics summarize behavior over time: request rates, latency percentiles, error counts, CPU utilization, resident memory, heap size, and garbage-collection activity. Both are essential, but neither necessarily identifies the function responsible for resource consumption.
A profile samples or records what the application runtime is doing. A CPU profile can reveal where execution time accumulates. A memory or allocation profile can reveal which code paths create objects or account for retained memory, depending on the profiler and profile type. A flamegraph then presents the captured call stacks as a hierarchy. Wide frames represent a larger share of the measured resource, such as sampled CPU time or allocated memory. The exact meaning depends on what was captured, so the profile type must always be recorded with the result.
Remote traffic matters because a local test can omit behavior that occurs when an application receives requests through a public entry point. Remote clients may have different connection reuse patterns, concurrency, payload sizes, timing, protocol behavior, or cancellation patterns. A public test can also involve slower clients that keep responses active longer. Those differences may expose application bottlenecks that a fast loopback benchmark does not reproduce.
With Localtonet, the client on the application host establishes an outbound connection to one of our relay servers. An HTTP tunnel provides a public URL, while a raw TCP tunnel provides a public host and port. This makes it possible to send controlled remote traffic to a local service without configuring inbound router port forwarding, changing the firewall to admit an unsolicited public connection, setting up a VPN, or requiring a public IP address.
End-to-end latency includes work performed by the client, public network path, relay path, Localtonet client, operating system, application, and any dependency called by the application. A server-side profile observes the application process or runtime. It does not directly measure every part of that end-to-end path.
The objective is therefore not to prove that tunneled and loopback latency are identical. They are different network paths, so some difference is expected. The useful question is whether the remote path changes application-side behavior. If the same application function becomes much hotter, allocation rises, lock waits increase, or garbage collection consumes more time during the remote run, profiling gives us evidence that the application is responding differently under that workload.
Build a measurement model before collecting data
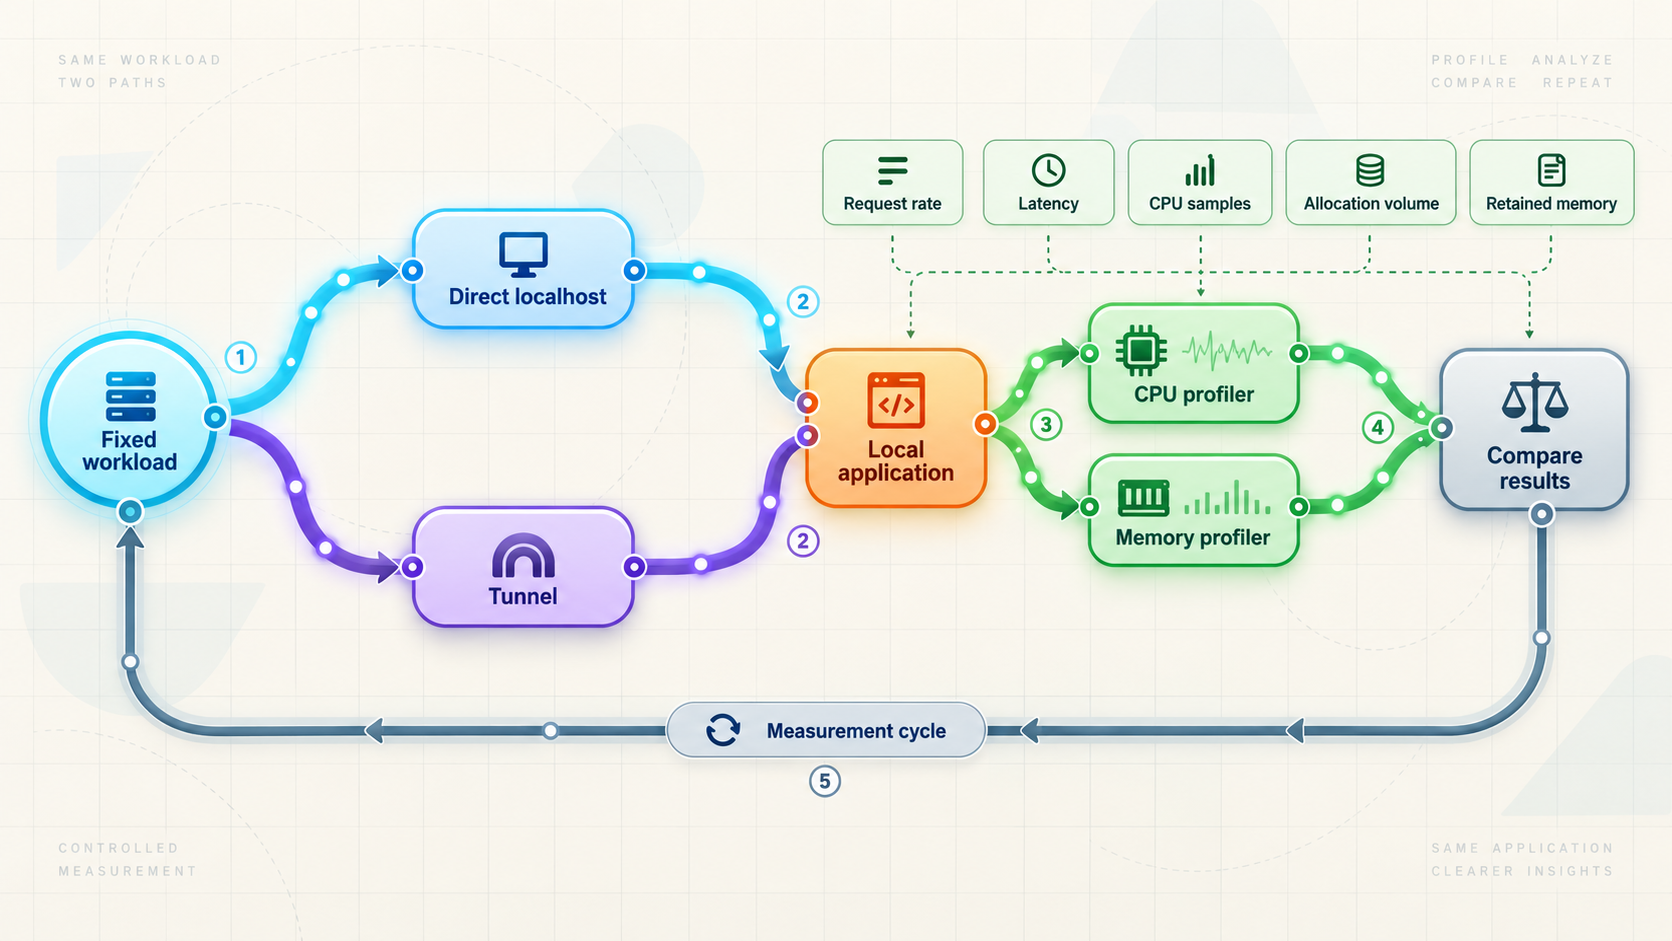
Profiling works best when it is part of a broader measurement plan. Start by dividing an observed request into components rather than treating one duration as a single unexplained number. At minimum, record client-observed latency and application-observed processing time. If the application calls databases, storage services, local models, or upstream APIs, capture their timings separately where the application already supports that instrumentation.
Keep timestamps synchronized across the load generator, application logs, metrics system, and profile capture. A profile that cannot be aligned with the traffic window may include startup, idle maintenance, health checks, or unrelated activity. Record the start and end of each run, the profile interval, the request rate, concurrency, response count, error count, and relevant application version.
Also distinguish inclusive and self cost. Inclusive cost attributes a frame with work performed by its descendants. Self cost attributes work directly to that frame. A broad request handler may have high inclusive cost because it invokes many expensive child functions, while one serialization routine below it may have the significant self cost. Both views are useful, but they answer different questions.
| Observation | Likely interpretation | Next evidence to inspect |
|---|---|---|
| Remote latency rises, but application time and profiles remain stable | The additional delay may be outside the instrumented application process | Client timing phases, connection reuse, request transfer, response transfer, and network conditions |
| Application time and CPU utilization rise together | The service may be CPU-bound or performing more work per request | CPU flamegraph, self-time table, request mix, payload size, and concurrency |
| Allocation rate rises and garbage collection becomes more frequent | Temporary object creation may be adding runtime overhead | Allocation profile, allocation hot paths, object types, and collection pause metrics |
| Live heap grows after traffic stops | Objects may be retained, or a legitimate cache or pool may have expanded | Comparable post-collection heap snapshots, retention paths, cache limits, and object ownership |
| CPU is not saturated, but requests queue or complete in bursts | Lock contention, thread starvation, event-loop blocking, connection-pool limits, or dependency waits may be involved | Wait or contention data, thread traces, queue depth, event-loop delay, and dependency timing |
Prepare a safe and repeatable profiling test
This guide is runtime-neutral because profiler commands, file formats, permissions, and heap semantics vary significantly among languages and versions. Use the profiler officially supported by the exact runtime that hosts your application. Confirm whether it captures sampled CPU stacks, instrumented events, allocations, live heap, retained heap, native frames, managed frames, or a combination of these. Do not assume that a file labeled “memory profile” measures retained memory.
Before testing, prepare the following items:
- A local application that is already running and can be reached from the device on which the Localtonet client will run.
- A documented local IP address and port for that application. Avoid relying on an assumed default port.
- A profiler supported by the application runtime and permission to attach it to the intended process.
- A remote load generator under your control, separate from the application host when testing the public path.
- A fixed request corpus, payload set, concurrency model, test duration, and warm-up procedure.
- Application logs and metrics that can be aligned with each profile window.
- A current Localtonet client and a device-specific authentication token obtained through the Localtonet platform.
- A selected relay server or region from the values currently available in the dashboard.
- A rollback plan so the profile and public tunnel can be stopped immediately if the service becomes unstable.
Do not point the tunnel at a profiler interface, runtime debug port, heap browser, metrics administration endpoint, debugger, or directory containing profile files. Diagnostic outputs can reveal function names, local paths, query text, object contents, configuration data, or other sensitive implementation details. Expose only the intended application endpoint and keep profiler access local or otherwise protected by your established administrative controls.
Use non-sensitive test data whenever possible. If the application processes uploaded files, messages, prompts, customer records, or credentials, create a representative synthetic corpus rather than copying production data into the test. Review the profiler's privacy characteristics as well. Some profiles contain only stack symbols and sizes, while heap inspection tools may expose object values.
Choose a workload that represents the behavior you are investigating. A one-request smoke test can verify connectivity but rarely creates a meaningful profile. Conversely, an uncontrolled stress test may overwhelm the machine so completely that it obscures the original issue. Begin below saturation, increase load deliberately, and identify the point at which latency, errors, queues, allocation, or memory changes.
Define the experiment before starting it
Write down a simple test matrix. At minimum, include an idle capture, a direct local run, and a tunneled run. If a code change is being evaluated, repeat both traffic paths before and after the change. Keep one run per condition when first validating the procedure, then repeat the important conditions several times to identify normal variation.
Match request count alone only when each request is approximately equivalent. For streaming responses, uploads, downloads, persistent connections, or variable payloads, also match bytes transferred, connection count, active duration, and operation type. For raw TCP services, record whether a run uses one long-lived connection, many short connections, or a stable pool. Those patterns can produce very different application behavior.
Capture a direct localhost baseline first
The localhost baseline tells us how the application behaves without the public tunnel path. It is not a prediction of internet performance. It is a control condition for the server-side work produced by a known request set.
- Restart the application only if restart state is part of the test design. Otherwise preserve the same steady-state conditions for every run.
- Record the application version, configuration, runtime version, process identifier, available CPU and memory, and any relevant dependency versions.
- Warm up the application consistently. This may populate caches, initialize connection pools, compile frequently used code, or load models and templates.
- Start application metrics and confirm that the profiler can attach without exposing a new network endpoint.
- Begin the profile shortly before the measured request window.
- Send the fixed workload directly to the application's local address.
- Stop the profile after the measured window and allow the application to become idle before collecting post-run memory evidence.
- Save the profile with a condition name, timestamp, application version, and run number.
Profiling itself has overhead. The amount depends on runtime, sampling frequency, profile type, call-stack collection, symbol resolution, and workload. Measure that overhead instead of assuming it is negligible. Compare an unprofiled baseline with a profiled baseline under the same request set. If profiling materially changes throughput or latency, lower the sampling intensity when supported, shorten the capture, or use several targeted captures rather than one prolonged session.
Memory tests need special care. Process resident memory, managed heap size, allocated bytes, and retained objects are not interchangeable. A runtime may reserve memory without immediately returning it to the operating system. A cache may intentionally remain warm. Native libraries and memory-mapped files may sit outside the managed heap. Capture the same memory signals at the same points in every run, including before traffic, near peak load, immediately after traffic, and after a comparable idle or garbage-collection state.
Sampling profiles contain statistical variation. One short capture may overrepresent a temporary operation or miss an intermittent path. Repeat the same condition and look for wide frames or allocation paths that recur before treating them as a stable bottleneck.
Add a Localtonet HTTP or TCP test path
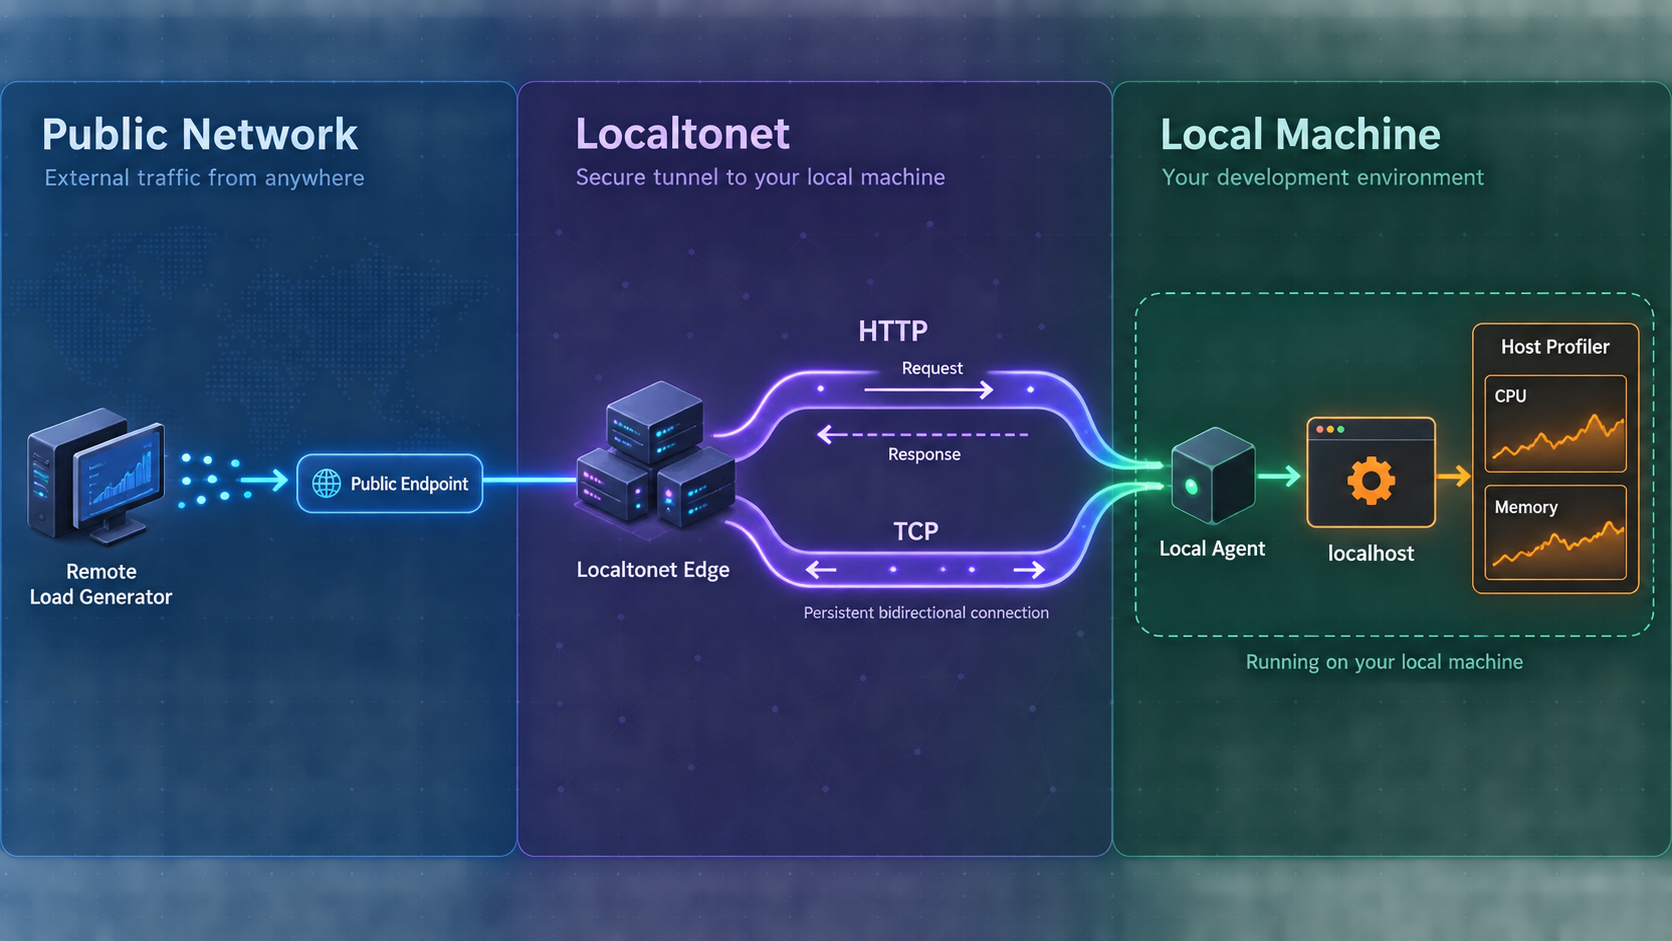
Choose the tunnel family that matches the application protocol. An HTTP tunnel is appropriate for a local web application or HTTP API. HTTP tunnels can use a generated subdomain, a selected subdomain where supported, or a custom domain. All of those process types serve the content at a public HTTPS address. Exact custom-domain DNS instructions must be checked against the current documentation before configuring a domain.
Use a raw TCP tunnel when the application protocol should pass as a TCP stream rather than as HTTP. The TCP tunnel points to the local IP address and port reachable from the client device and provides a public host and port. Do not label either option a VPN. Standard HTTP and TCP tunneling publishes a selected service; VPN Manager is our separate private mesh VPN feature.
| Path | Use it for | Public entry point | Important measurement detail |
|---|---|---|---|
| Direct localhost | Application-side control condition | None | Removes the public network and relay path but may also change client and connection behavior |
| Localtonet HTTP tunnel | Web applications and HTTP APIs | Public HTTPS address | Keep HTTP method, headers, payload, concurrency, and connection behavior comparable |
| Localtonet TCP tunnel | Raw TCP services | Public host and port | Match connection lifetime, message sequence, bytes transferred, and simultaneous connections |
Follow this documented Localtonet workflow without hardcoding a token, server code, or region. Available relay values must come from the current product or dashboard.
Install and run the Localtonet client
Run the client on the device that hosts the application or can reach its local IP address and port. Confirm the application itself is healthy before adding a tunnel.
Authenticate and select the device
Use the device-specific authentication token supplied through our platform. Treat the token as a credential. Do not place it in scripts, screenshots, logs, profile filenames, or the public article.
Select an available relay server or region
Choose from the values currently shown in the Localtonet product or dashboard. Availability can vary, so do not copy a server code from an unrelated example.
Create the appropriate HTTP or TCP configuration
Point the tunnel to the exact local IP address and port of the intended application. Use HTTP for a web application or API and raw TCP for a TCP service. Do not target a profiler, debugger, or administrative interface.
Start the tunnel and verify the assigned endpoint
Creating a tunnel does not mean it is running. Use the Start button, then verify the assigned public URL or public host and port with a small request before beginning the measured workload.
Stop or delete the tunnel when testing is complete
A tunnel remains available only while the selected client or device is connected and the tunnel is running. Stop it when the public test path is no longer required, or delete the configuration if it should not be reused.
For HTTP-specific product guidance, consult our Localtonet HTTP tunnel documentation. Use the current dashboard and documentation for exact fields and available options because those details should not be inferred from old examples.
Apply application authentication, least-privilege test accounts, narrow permissions, request validation, and any appropriate access restrictions. Do not assume an unlisted URL is private. Avoid destructive routes and rate-limit the load generator to a level the host and application can safely handle.
Capture CPU and memory evidence during tunneled traffic
Keep the application, dataset, host state, and workload definition as close as possible to the direct baseline. Change the client destination from the local address to the assigned Localtonet public endpoint. Run the load generator from a remote system under your control so the request actually follows the intended public path.
CPU profiling
Begin the CPU capture shortly before measured traffic and stop it shortly after the request window. Avoid including a long idle period because it can dilute the samples associated with the workload. If startup behavior is not the subject of the test, warm up first and profile steady state.
A useful CPU capture should include enough completed requests to sample recurring work. If the profile is almost entirely idle frames, either the application did not receive sufficient traffic, the wrong process was profiled, or the capture missed the request window. If one background task dominates, repeat the run after determining whether that task is expected and whether it occurs equally in both conditions.
Save the raw profile file as well as any exported visualization. The raw file often supports alternate views such as top functions, caller and callee relationships, source lines, or filtered stacks. Keep both private because symbol names and paths can disclose implementation details.
Allocation and heap profiling
Allocation profiling answers which paths create memory. It is particularly useful when the application experiences high garbage-collection frequency, CPU time in the collector, or large bursts of temporary data. Common categories to investigate include request-body buffering, response assembly, serialization, decompression, parsing, logging, regular expressions, image processing, duplicate copies, and per-request caches.
Retained-memory analysis answers a different question: what remains reachable at the observation point. If memory grows during load but returns to a stable level afterward, the issue may be allocation pressure rather than a leak. If comparable post-load snapshots show continuing growth across repeated cycles, inspect retention paths and ownership. A cache without a suitable bound can resemble a leak, but the remediation differs from an accidental reference chain.
Take care when comparing snapshots. The application should be in a similar lifecycle state, with comparable traffic completed and comparable cleanup opportunities. Some profilers can trigger or observe collection; others cannot. Record exactly what was done rather than presenting heap totals without context.
Contention and waiting
A CPU flamegraph may not fully explain an application that is slow while CPU utilization remains moderate. The process may be waiting on locks, semaphores, thread pools, event-loop work, database connections, file operations, or upstream responses. Use runtime-supported contention, blocking, thread, or asynchronous tracing when available. Do not infer “network latency” merely because no wide CPU frame appears.
Correlate profiles with queue depth and active work. If throughput plateaus while the number of waiting requests grows, determine which finite resource is exhausted. Possibilities include worker threads, database connections, an internal concurrency limit, a single serialized critical section, or a downstream service. The profiler can identify where execution or waiting concentrates, but application metrics establish whether that path controls throughput.
How to interpret CPU and memory flamegraphs
A flamegraph is a map of captured call stacks. Each rectangle is a frame. Frames stacked vertically show call relationships: a lower function called the function above it. Horizontal width represents the proportion of the measured resource attributed to stacks containing that frame. Horizontal position usually does not represent chronological order, so do not read the graph from left to right as a request timeline.
Start with the widest frames
Wide frames identify major resource consumers within that capture. Zoom into them and inspect descendants. A wide request handler may simply be the parent of all request work. Continue downward or upward according to the viewer until you locate specific functions with meaningful self cost, repeated descendants, unexpected recursion, or calls that should not occur as often as they do.
Use a table or top-function view when labels are too narrow to read. Sort by self samples and inclusive samples. A function with large inclusive cost coordinates expensive work. A function with large self cost performs expensive work directly. Both can be optimization candidates, but a coordinator should not be rewritten until its expensive child path is understood.
Look for repeated and avoidable work
Profiling often reveals code that is correct but unnecessarily repeated. Examples include serializing the same data twice, recomputing metrics, parsing configuration per request, walking an object tree recursively from multiple levels, compiling patterns repeatedly, or rebuilding immutable response fragments. Verify call counts with logging or counters before changing behavior.
A wide function is not automatically waste. Compression, cryptography, parsing, model inference, image transforms, and copying response bytes may be inherently expensive and necessary. The optimization question is whether the work can be reduced, reused, batched, bounded, moved out of the request path, or performed with a more appropriate algorithm without changing required behavior.
Interpret memory width correctly
In a memory flamegraph, width may represent allocated bytes, allocation samples, object count, or retained bytes. Those meanings are not equivalent. A path that allocates many short-lived objects can dominate an allocation profile but contribute little to a retained heap. A smaller number of long-lived objects may dominate retained memory while barely appearing in a short allocation capture.
Identify the profile's unit before making a claim. Then inspect object type, allocation stack, retaining path, and lifetime when supported. Ask whether the object belongs to a request, cache, queue, connection, global collection, subscription, callback, or native resource. A plausible ownership story is more useful than a screenshot of one wide bar.
Account for symbols and source mapping
Optimized builds can inline functions, merge frames, omit frame pointers, or produce generated and minified names. Managed runtimes may show runtime internals around application frames. Native extensions can appear as unresolved symbols if debugging information is unavailable. JavaScript or TypeScript applications may require source maps for readable source-level names, depending on the runtime and profiler.
If symbols are missing, do not guess which application function a frame represents. Preserve the exact application build and symbol artifacts required by the profiling tool, then repeat or reprocess the capture according to that runtime's official procedure.
Compare localhost and tunneled results without blaming the wrong layer
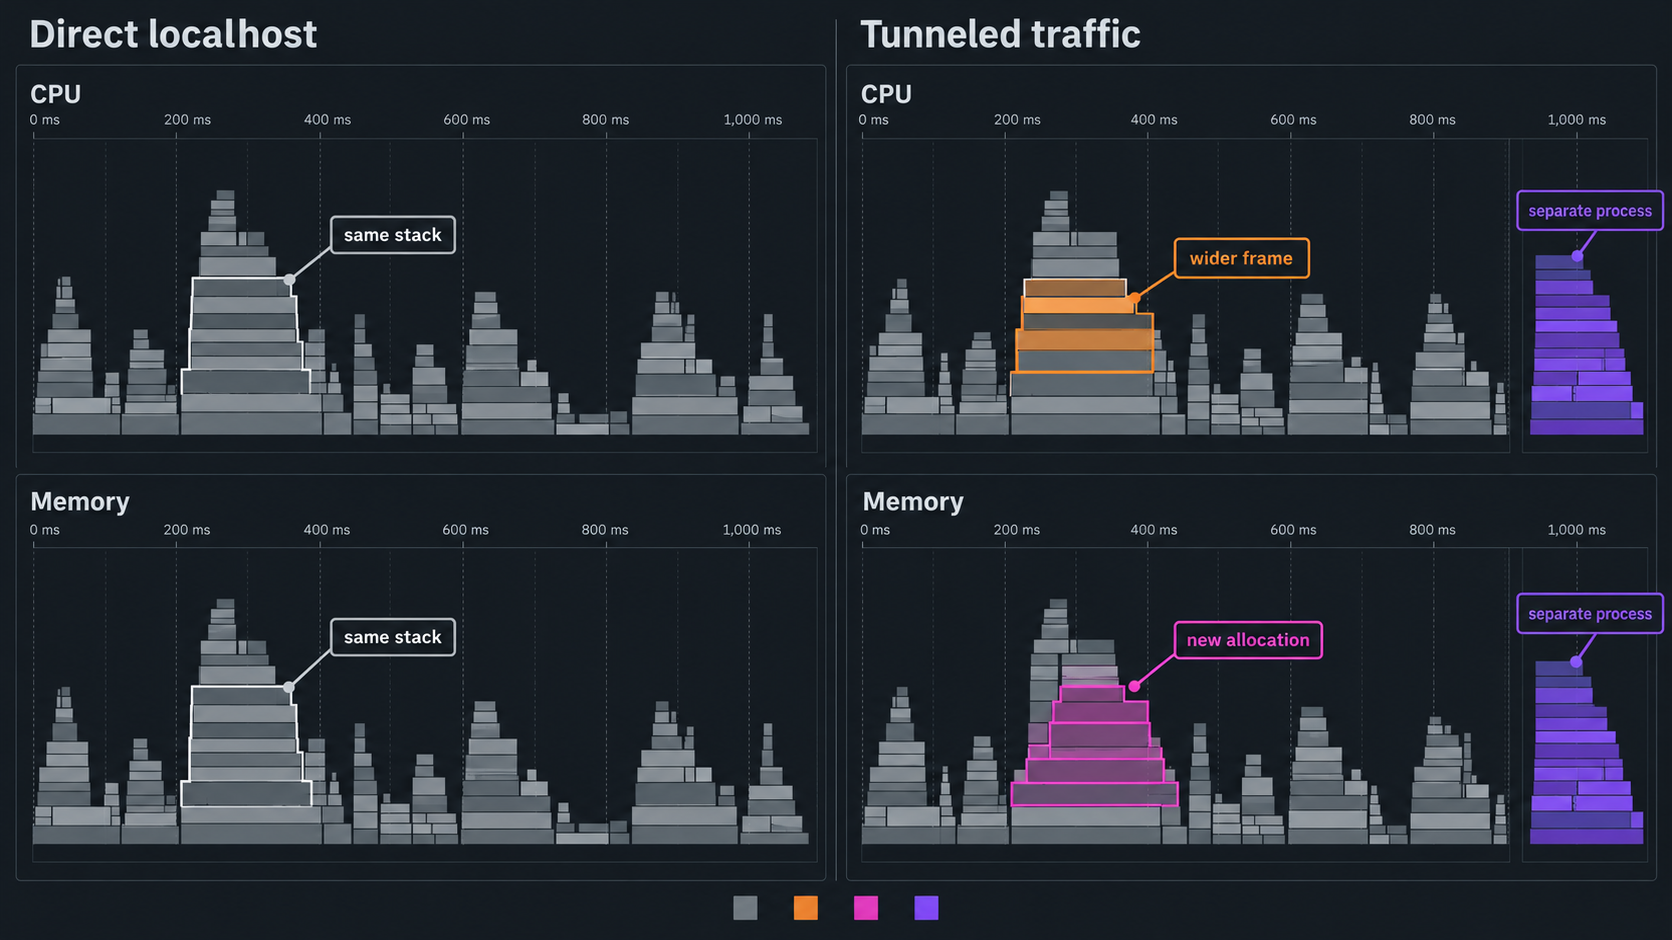
Compare equivalent runs in a fixed order. Start with completed requests, error rates, payload volume, and achieved throughput. Next compare client-observed latency and application-observed duration. Then compare CPU utilization, profile composition, allocation rate, garbage collection, live memory, contention, and dependency timing.
Normalize profile results when run durations or completed request counts differ. A function can accumulate more total samples simply because one run lasted longer or completed more work. Useful normalizations include CPU time per completed operation, allocated bytes per request, allocations per message, or memory retained after an equal number of workload cycles. Use only units supported by the profiler and metrics you actually collected.
| Comparison result | What it suggests | Validation step |
|---|---|---|
| Same profile shape and application duration, higher remote end-to-end latency | The application appears to perform similar work; additional time may be elsewhere in the end-to-end path | Break down connection setup, request upload, time to first byte, response transfer, and connection reuse |
| More application CPU per request through the remote workload | The workloads may differ in headers, payloads, connection handling, middleware, serialization, or protocol behavior | Compare captured request characteristics and inspect newly widened application frames |
| Higher allocations with similar business operations | Remote request characteristics may trigger buffering, parsing, logging, or response construction differences | Compare allocation stacks and bytes per operation |
| Memory rises with concurrent remote clients and does not settle | Per-connection state, pending work, queues, caches, or references may remain live | Reduce concurrency, close connections cleanly, repeat cycles, and inspect retention paths |
| Latency rises sharply near a stable throughput ceiling | A bounded resource may be saturated | Check CPU, runnable threads, event-loop delay, queues, locks, connection pools, and dependency capacity |
| Only one run contains a wide background function | A periodic task or unrelated process phase may have contaminated the comparison | Repeat the run and align the capture with the workload window |
Use an A/B/A sequence
A useful sequence is direct, tunneled, then direct again. If the second direct run resembles the tunneled run rather than the first direct run, the difference may be caused by thermal throttling, cache growth, a dependency slowdown, background work, or accumulated application state. Alternating conditions and repeating them helps separate path effects from time effects.
Verify every optimization
After changing code, repeat the same test matrix. Confirm that the target frame shrank in absolute or normalized terms, not merely as a percentage because another function became larger. Check throughput, tail latency, errors, allocation, memory, and correctness. An optimization that moves work elsewhere, increases memory retention, or changes response behavior is not automatically an improvement.
Keep concise experiment records: hypothesis, change, workload, environment, profiles, metrics, outcome, and decision. This prevents teams from repeatedly investigating the same frame and makes regressions easier to recognize.
Troubleshooting profiling and tunnel test anomalies
The profile is empty or mostly idle
Verify that the remote request reached the intended application instance and that the profiler attached to the correct process. Align the profile interval with the load window. Increase the number of representative operations rather than extending the capture with idle time. If the application delegates work to child processes or separate workers, confirm which process performs the expensive operation.
The tunnel exists but the public endpoint is unavailable
Remember that creating a tunnel does not start it. Confirm that the selected Localtonet client or device is connected and that the tunnel is running. Verify that the configured local IP address and port are reachable from that client device. Check the application locally before investigating the public path. The tunnel is available only while the selected client is connected and the tunnel remains running.
HTTP testing works locally but returns different behavior remotely
Compare the method, path, host handling, headers, authentication, content type, request body, redirects, and response compression. Ensure the remote load generator is not silently changing the request or following redirects differently. Inspect application logs for the exact route and status. Do not disable authentication merely to make the benchmark easier.
A TCP service fails only with the remote load generator
Confirm that the client is connecting to the assigned public host and port and speaking the exact application protocol. Compare connection lifetime and message framing with the local test. A successful TCP connection does not prove that the application-level handshake or message sequence is valid.
CPU is high, but the flamegraph has no obvious application frame
Look for runtime, garbage-collector, kernel, native-library, or unresolved-symbol frames. Verify whether the profiler includes all relevant threads and native stacks. Compare process CPU with machine-wide CPU so another process is not mistaken for the application. If symbols are missing, resolve that limitation before attributing the cost.
Memory usage remains high after traffic stops
Determine which memory measurement remains high. Resident memory may stay elevated because the runtime retains reserved pages, even when live heap has fallen. Compare live object data, retained heap, native allocations, cache size, active connections, queued work, and process resident memory separately. Repeat a controlled load and idle cycle to see whether memory stabilizes at a new plateau or grows without a bound.
Profiling changes the result too much
Measure profiler overhead under the same baseline. When the runtime permits it, reduce capture detail or sampling frequency, shorten the window, or capture one profile type at a time. Avoid collecting CPU, heap, contention, verbose logs, and full request traces simultaneously unless the host can tolerate the combined overhead.
Remote latency varies significantly between runs
Repeat tests from the same remote system and use the same Localtonet relay selection. Record connection reuse and distinguish warm connections from new connections. Keep the application host free from unrelated CPU, disk, and memory pressure. Report a distribution such as median and tail percentiles rather than relying on one request or a single average.
Frequently asked questions
Does a slower request through a tunnel mean the application is not the bottleneck?
No. End-to-end latency contains network and relay time, but it also contains application processing and response transfer. Compare client timing with application timing, CPU profiles, allocation data, garbage-collection metrics, and dependency latency. The evidence should identify which component changed.
Should I use a Localtonet HTTP tunnel or TCP tunnel for profiling?
Use an HTTP tunnel for a web application or HTTP API. Use a raw TCP tunnel when the application expects a TCP protocol rather than HTTP handling. Both point to a local IP address and port reachable from the Localtonet client device, but the public endpoint format and protocol behavior differ.
Can I expose my profiler interface through the same tunnel?
That is not recommended. Expose only the intended application endpoint. Keep profiler interfaces, debugger ports, heap viewers, administrative metrics endpoints, and diagnostic files private and protected by your normal administrative access controls.
What does the width of a flamegraph frame mean?
Width represents a share of the resource measured by that specific profile. For a CPU sampling profile, it commonly reflects sampled CPU presence. For a memory profile, it might represent allocated bytes, allocation samples, object count, or retained memory. Confirm the profiler's unit before interpreting the graph.
Is a wide function always a performance bug?
No. A wide frame may represent necessary work, or it may be a parent whose children perform the real work. Inspect self and inclusive cost, call frequency, descendants, request correctness, and algorithmic necessity before optimizing it.
How can I distinguish allocation pressure from a memory leak?
Allocation pressure creates substantial temporary memory and can increase garbage-collection work even if live memory later falls. A suspected leak involves objects remaining reachable across comparable workload and cleanup cycles. Use allocation profiles for creation paths and retained-memory evidence for ownership and retention paths.
Why should I repeat the same profile several times?
Sampling varies, and periodic maintenance or background tasks can dominate a single capture. Repeated runs show whether a hot path is stable and whether an apparent difference is larger than normal run-to-run variation.
Does creating a Localtonet tunnel make it active immediately?
No. Creating the configuration does not mean the tunnel is running. Start it with the Start button. The public endpoint remains available only while the selected client or device is connected and the tunnel is running.
Test your application through a controlled public path
Run the Localtonet client beside your application, expose only its intended HTTP or TCP endpoint, and compare repeatable remote traffic with your direct localhost baseline. Keep profiling interfaces private, capture evidence during matched workload windows, and stop the tunnel when the experiment is complete.
Get Started Free →