

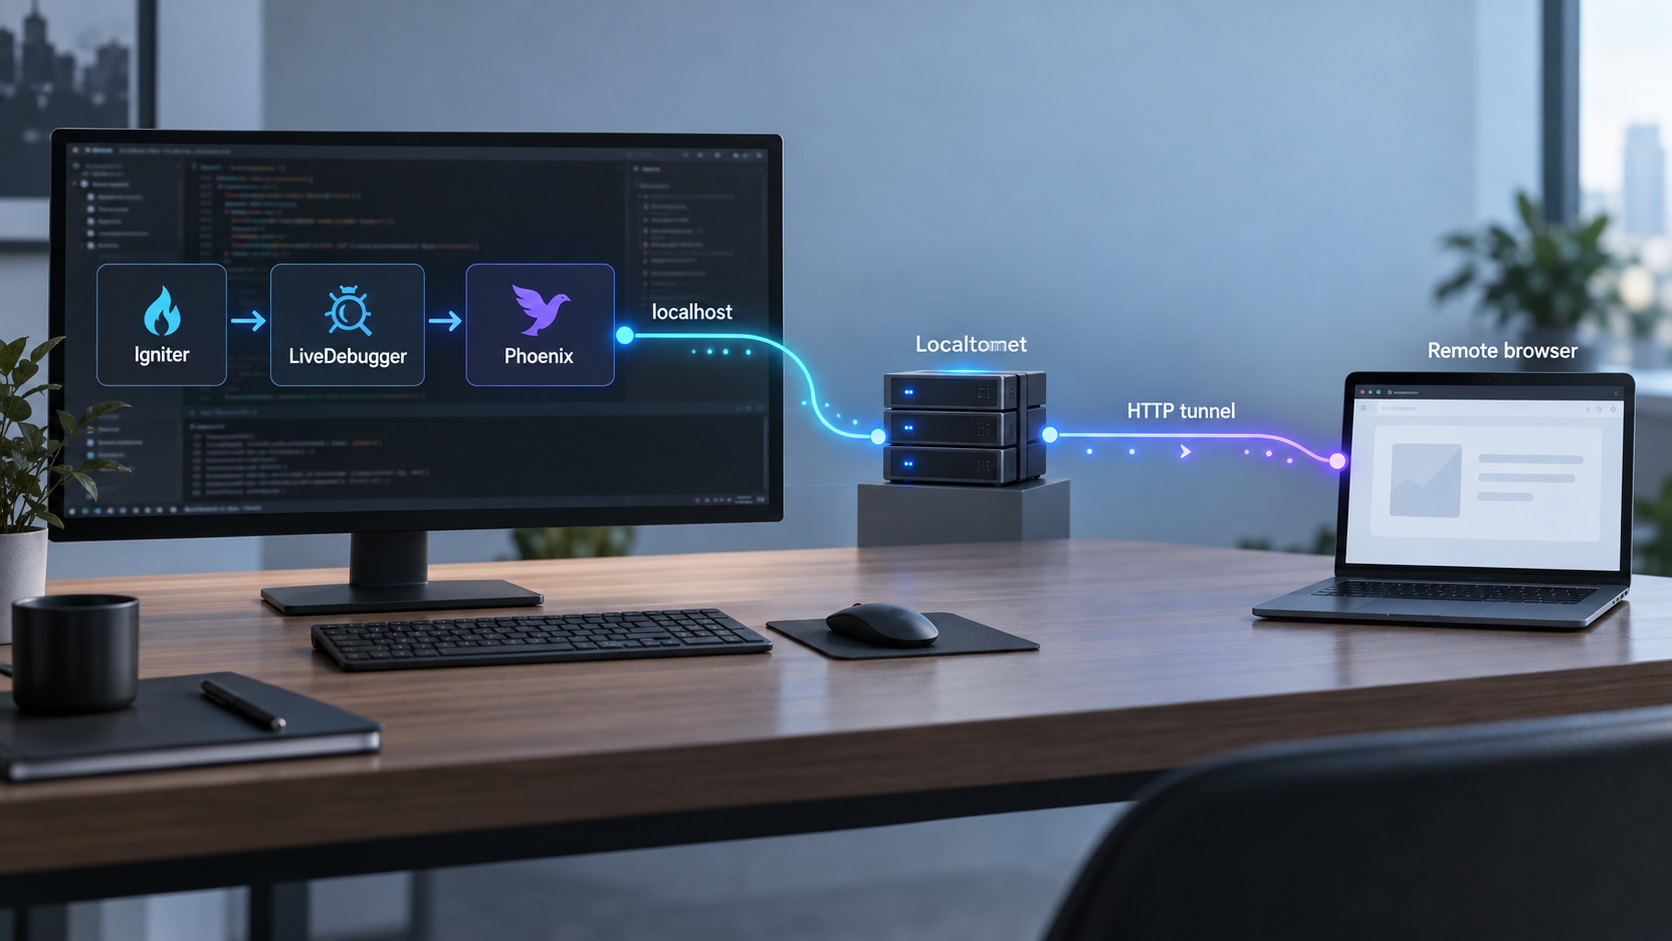
Debug Phoenix LiveView locally, then reach the development interface from a remote browser
LiveDebugger provides a browser-based view into Phoenix LiveView component trees, assigns, callback execution, state transitions, and rendered elements. This guide installs it with the project’s documented Igniter command, checks the generated development-only integration, starts the existing Phoenix application, and verifies the debugger at its default local endpoint. Once the local interface works, we explain how to expose that endpoint through a Localtonet HTTP tunnel without configuring inbound router port forwarding, changing firewall rules, setting up a VPN, or requiring a public IP address. Because LiveDebugger is explicitly a development tool, the workflow also emphasizes restricted use, short-lived tunnels, and careful handling of debugger data.
📋 What's in this guide
How LiveDebugger, Igniter, Phoenix, and Localtonet fit together
LiveDebugger is an embedded development tool for applications built with Phoenix LiveView. It is not a separate replacement for the Phoenix application and the browser extension alone is not sufficient. The main LiveDebugger dependency must be installed in the Mix project, and the application must be running for the debugger endpoint to be available.
The tool is designed to help developers examine what is happening inside a LiveView application. Its documented capabilities include viewing the LiveView and LiveComponent tree, inspecting assigns in real time, tracing and filtering callback execution, observing state transitions, and selecting rendered elements to identify the component that produced them. These capabilities can reveal application structure and runtime state, which is useful during development but also explains why the interface should not be exposed casually.
Igniter is the installation path emphasized in this guide. LiveDebugger’s documented Igniter integration uses one command to add the dependency and modify the application’s root layout. A manual installation is also documented and is covered later as a fallback or review reference.
After the Phoenix application starts successfully, LiveDebugger uses http://localhost:4007 by default. That address is local to the machine or execution environment hosting the application. When the browser is on another computer, localhost refers to that other computer, not to the Phoenix host. A remote browser therefore cannot reach the endpoint merely by typing the local URL.
With Localtonet, the client running on a device that can reach the debugger establishes an outbound connection to one of our relay servers. An HTTP tunnel then provides a public HTTPS address that forwards requests to the selected local IP address and port. No inbound router port forwarding, public IP address, VPN setup, or inbound firewall change is required for this tunnel model. The tunnel remains available only while the selected Localtonet client is connected and the tunnel is running.
The project maintainers explicitly warn against production use and require the dependency to be development-only. Do not treat a Localtonet tunnel as a reason to install the debugger in a production release. This guide assumes a controlled development environment, a development-only dependency, and temporary remote access for an authorized developer.
Prerequisites and environment checks
Begin with an existing Phoenix LiveView application that you are authorized to modify and debug. The application should already have a working local development procedure. LiveDebugger’s installation documentation supplies the dependency, root-layout integration, and debugger endpoint, but it does not define a universal Phoenix startup command for every host project. Applications may have their own environment preparation, database, asset, service, or secret requirements, so retain the startup procedure already established by your project.
The Igniter path also assumes that Igniter is available to the project in a form that supports the documented mix igniter.install task. The supplied LiveDebugger evidence does not establish a universal Igniter installation command, an exact supported Igniter version, or a supported Elixir, Erlang, Phoenix, or Phoenix LiveView version matrix. We therefore do not guess those details. If the Mix task is unavailable, use the project’s documented dependency-management process to add Igniter, or use the manual LiveDebugger installation shown in this guide.
Project-side checklist
- An existing Phoenix application that uses Phoenix LiveView.
- A local development environment capable of running the application successfully.
- Mix available in the shell where the project is managed.
- Permission to change
mix.exsand the application root layout. - Igniter available if you intend to use the primary installation method.
- A clean or committed working tree so the generated changes are easy to inspect.
- A browser on the development machine for local verification.
Localtonet-side checklist
- A Localtonet account and access to the current dashboard.
- The Localtonet client installed on the Phoenix host, or on another device that can reach the LiveDebugger endpoint.
- A device-specific authentication token selected without exposing it in source code, screenshots, logs, or this article’s commands.
- An available relay server or region selected from the current dashboard rather than copied from an old guide.
- An HTTP tunnel configuration targeting the local debugger address and default port
4007, provided that your application has not changed that default.
Do not create the public tunnel before the debugger works on its local URL. Local verification separates application installation problems from tunnel configuration problems. If http://localhost:4007 does not work on the host, forwarding that same endpoint will not repair the underlying Phoenix or LiveDebugger setup.
Install LiveDebugger with Igniter
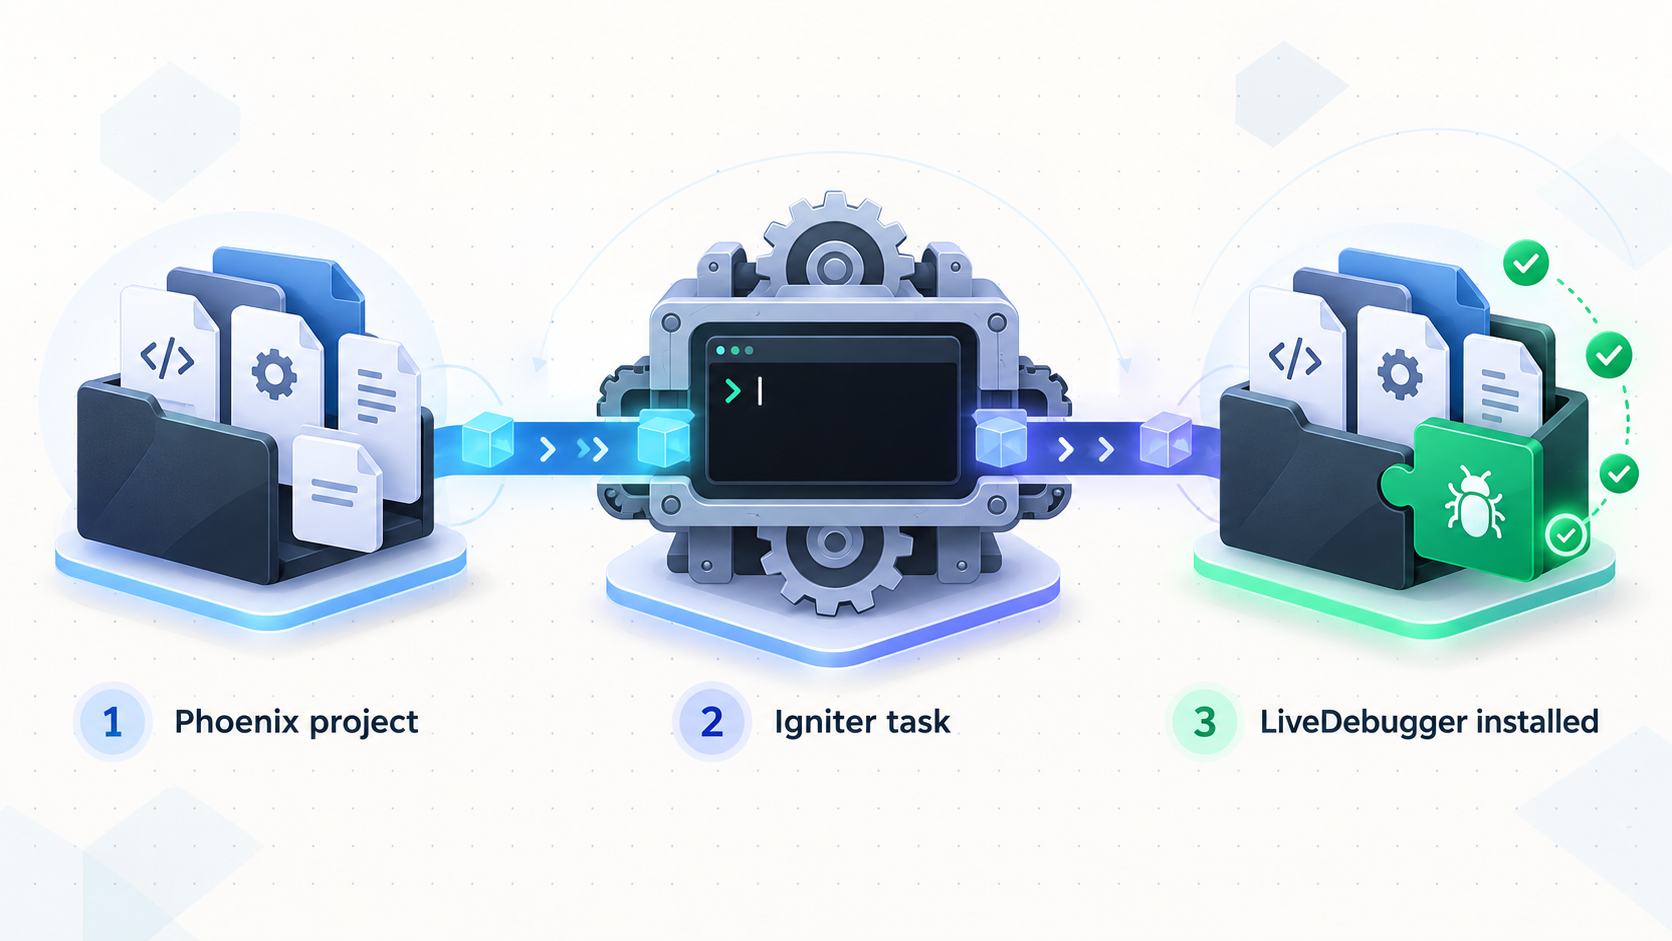
Run the installation from the root directory of the Phoenix project, where its mix.exs file is located. Before changing the project, commit or otherwise preserve the current state. Igniter is expected to modify project files, and having a known baseline makes the result easier to review or revert.
Open the existing Phoenix project
Use a terminal in the application’s project root. Confirm that this is the intended development project and that its normal dependencies and local services are in a state where the application can be started after installation.
Run the documented Igniter installer
Execute the LiveDebugger Igniter command exactly as documented. It is intended to add the LiveDebugger dependency and modify the application root layout automatically.
Review the generated changes
Inspect the resulting project diff. Verify that LiveDebugger is development-only and that the root layout contains the documented LiveDebugger tags expression in its <head>. Resolve any reported conflict rather than assuming a partially applied transformation is complete.
Use the project’s normal dependency and startup workflow
Follow the existing application procedure for dependency retrieval, environment setup, database preparation, assets, and server startup. The exact sequence is application-specific and is not established by the LiveDebugger installation evidence, so this guide does not invent a universal command.
The documented installer command is:
mix igniter.install live_debugger
After it completes, inspect mix.exs. The resulting dependency should preserve the project’s development-only requirement. The documented manual form is shown below so that you have a concrete comparison point:
defp deps do
  [
    {:live_debugger, "~> 1.0.0", only: :dev}
  ]
end
Also inspect the application root layout. In the default path shown by LiveDebugger’s documentation, that file is lib/my_app_web/components/layouts/root.html.heex. The my_app_web segment is an example namespace, so your project’s actual path will normally reflect its application module. Do not create an unrelated duplicate layout merely because the example path differs from your project.
The root layout integration should place this expression inside the document’s <head>:
<head>
  <%= Application.get_env(:live_debugger, :live_debugger_tags) %>
</head>
This expression attaches the LiveDebugger meta tag and scripts in the development environment, enabling the browser-side features. If the Igniter command reports that it cannot identify or modify the layout, review the actual root-layout structure and apply the documented expression manually. Do not leave an unreviewed partial change in place.
The dependency declaration must retain only: :dev. Moving LiveDebugger into general dependencies, enabling it in a production release, or exposing a production application’s internal state contradicts the project’s stated usage warning. Treat this as a hard environment boundary, not merely an optimization.
Manual installation alternative
The manual method is useful when Igniter is not available, when its transformation cannot match a customized project layout, or when you prefer to apply each change yourself. It performs the same two documented integration tasks: adding the development-only dependency and inserting the LiveDebugger tags expression into the application root layout.
Add the Mix dependency
Add {:live_debugger, "~> 1.0.0", only: :dev} to the list returned by the project’s existing deps/0 function. Preserve the surrounding dependencies and valid Elixir syntax.
Insert the root-layout expression
Find the root HEEx layout used by the Phoenix application and add <%= Application.get_env(:live_debugger, :live_debugger_tags) %> inside its <head>. The documented example path is lib/my_app_web/components/layouts/root.html.heex, but use your application’s real namespace and layout.
Start the application in development
Retrieve dependencies and start the Phoenix application according to the project’s established development instructions. Confirm that the process starts without compilation, configuration, or template errors before testing LiveDebugger.
| Installation path | What it changes | When to use it |
|---|---|---|
| Igniter installation | Adds the dependency and modifies the root layout through the documented Igniter task. | Use when Igniter is available and the project structure can be transformed successfully. |
| Manual Mix dependency | Adds live_debugger to mix.exs with only: :dev. |
Use when you need direct control over dependency changes or Igniter is unavailable. |
| Manual layout integration | Adds the LiveDebugger tags expression to the root layout’s <head>. |
Use when a customized layout prevents automatic modification or when reviewing a partial Igniter result. |
The two installation paths are alternatives, not cumulative requirements. If Igniter correctly made both changes, do not add a duplicate dependency or duplicate tags expression. Review the generated diff first and apply only what is missing.
Start the Phoenix application and verify LiveDebugger locally
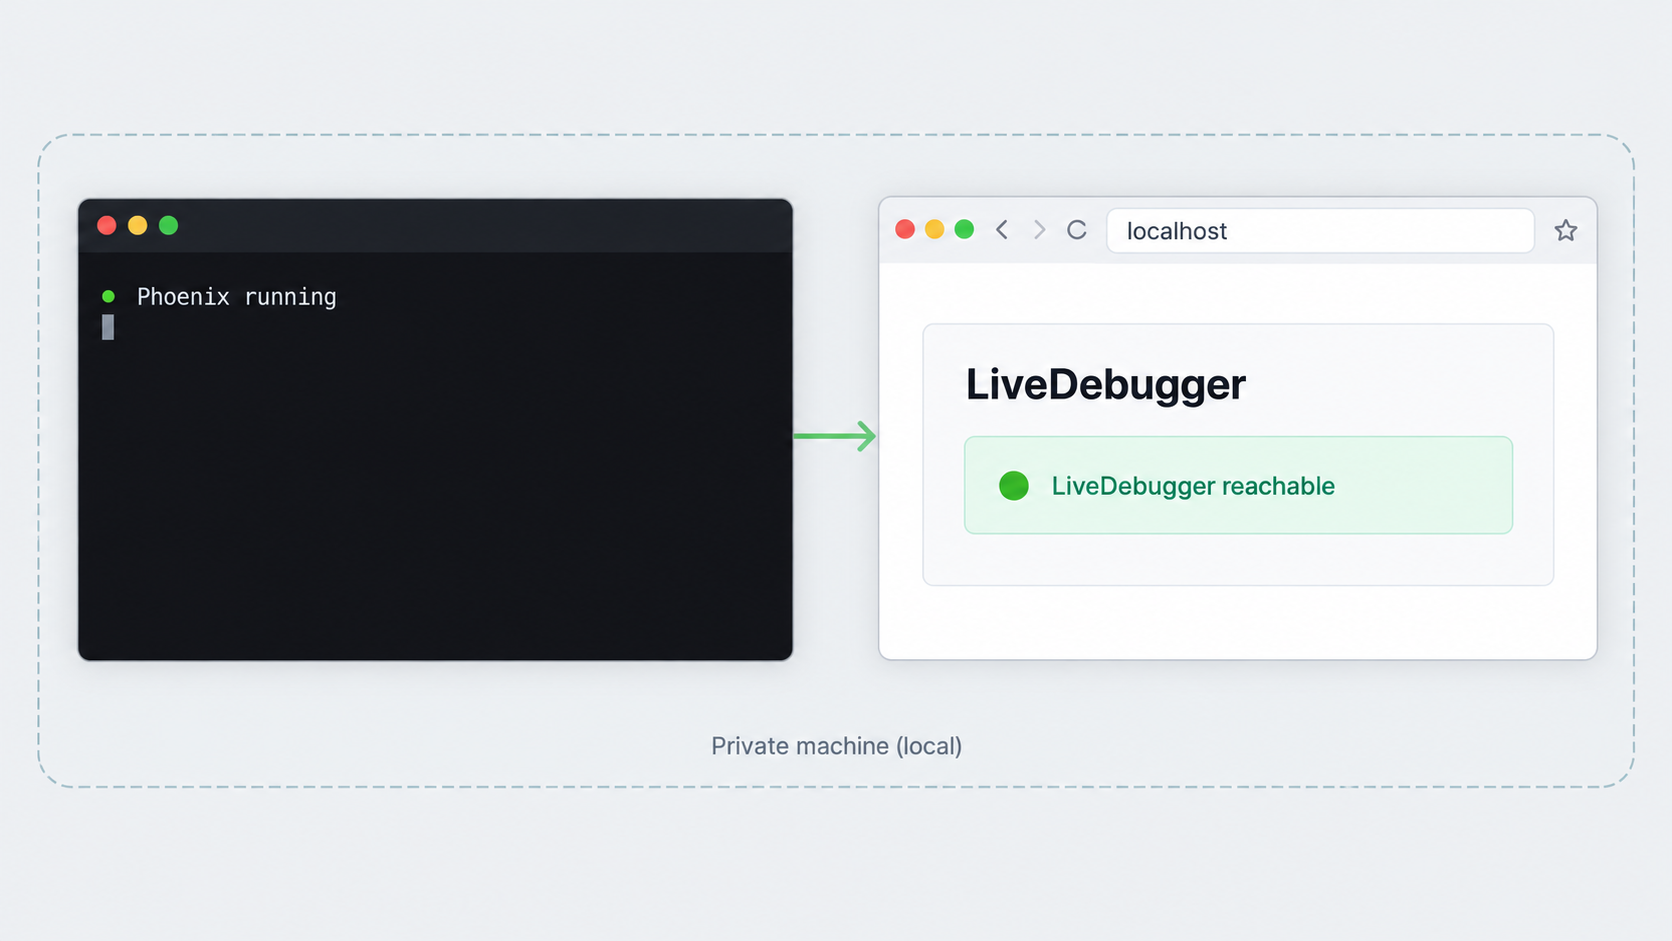
Installation is complete only after the host application starts and the debugger endpoint responds. LiveDebugger’s documented default address is http://localhost:4007. The endpoint appears after the Phoenix application starts, so an inactive or failed application process will leave nothing for Localtonet to forward.
Start the application in its development environment
Use the startup procedure already defined by the Phoenix project. Keep the process running and watch its output for dependency, compilation, template, configuration, database, or port errors.
Open the default debugger endpoint on the host
From a browser on the same machine or within the same effective network environment as the application, open http://localhost:4007. If the project has explicitly customized LiveDebugger’s configuration, verify the configured endpoint instead of assuming the default.
Exercise the Phoenix LiveView application
Open the application being debugged and interact with a relevant LiveView. Use LiveDebugger to check that the component tree, assigns, callback activity, or element inspection behavior is populated as expected.
Resolve local problems before tunneling
If the endpoint does not open or lacks expected data, return to the dependency, environment, root-layout, and application logs. Create the Localtonet tunnel only after the local interface is consistently reachable.
What successful verification looks like
A successful check has three parts. First, the Phoenix application remains running without a fatal startup error. Second, the browser can open the LiveDebugger interface at the local endpoint. Third, interaction with a LiveView produces useful debugging information, such as its component structure or assigns. Merely finding that port 4007 accepts a connection is not as complete as confirming that the interface is functional.
Optional browser extension
LiveDebugger also provides optional Chrome and Firefox DevTools extensions. These allow developers to interact with LiveDebugger features alongside the application runtime. The extension does not replace the Mix dependency, root-layout integration, running Phoenix application, or debugger endpoint. Install it only as an optional workflow enhancement after the main integration is working.
localhost always refers to the current network environment. If Phoenix runs inside a container, virtual machine, or another isolated environment, opening localhost:4007 on the physical host may not reach it automatically. The supplied project evidence does not define container mappings or alternate bind settings, so use the networking arrangement established by your application and confirm reachability from the device that will run the Localtonet client.
Expose the verified debugger with a Localtonet HTTP tunnel
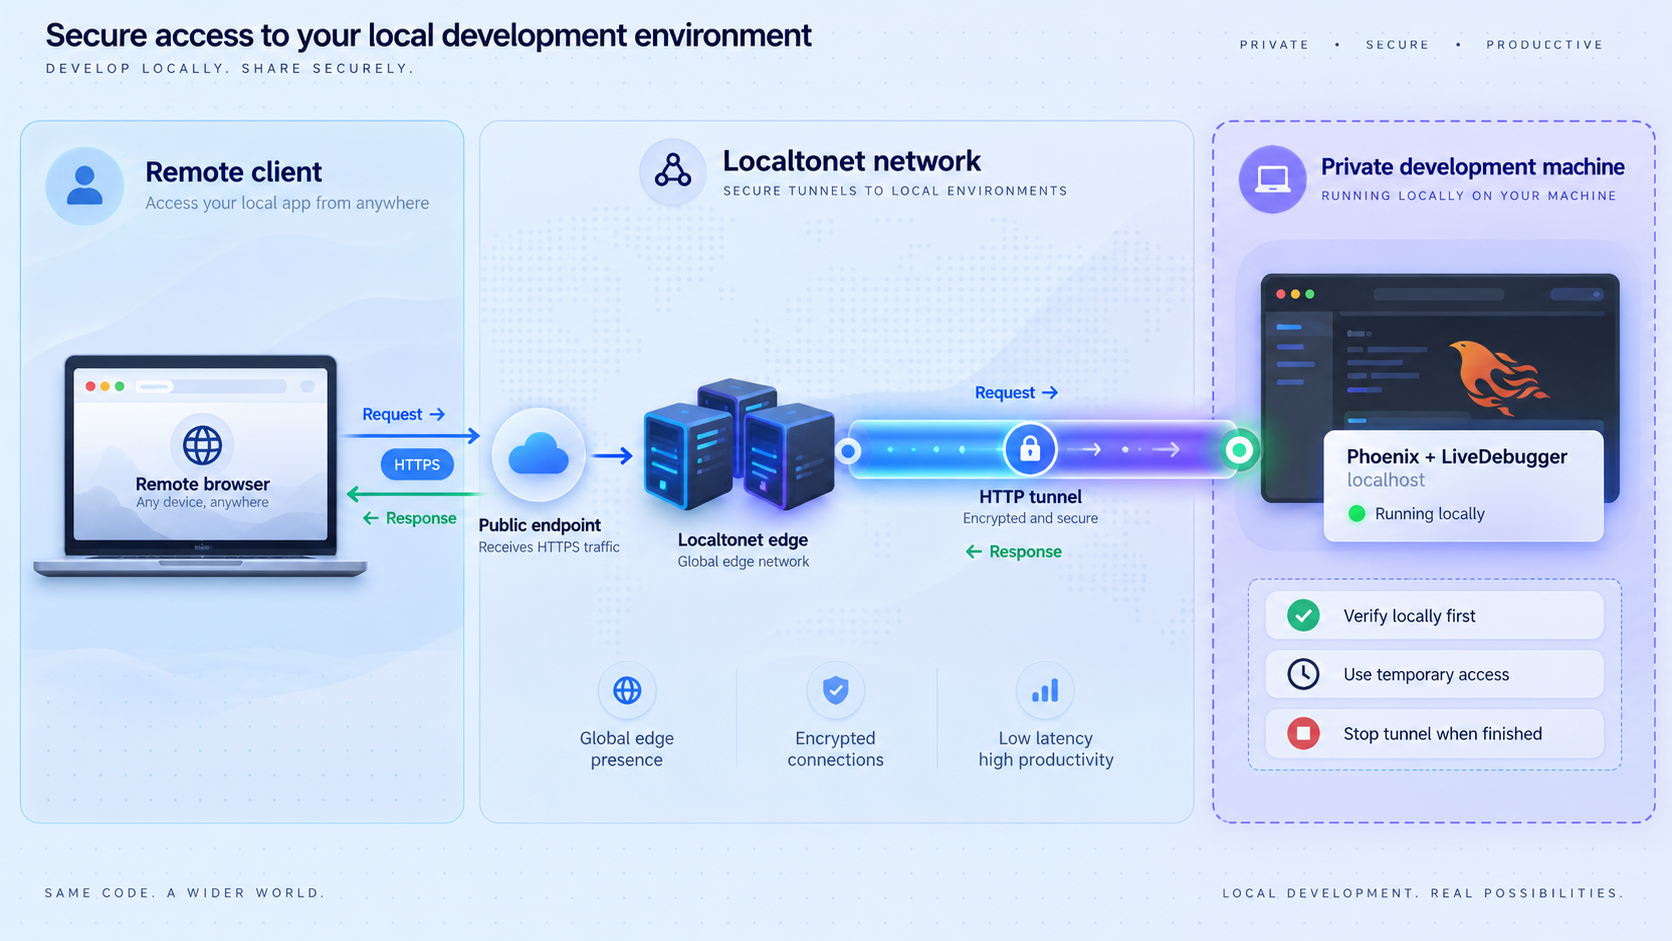
LiveDebugger presents a browser-based HTTP endpoint, so the appropriate Localtonet family for this workflow is an HTTP tunnel. The tunnel should point to the same local address and port that you just verified. For the documented default on a Localtonet client running in the same environment, that target is localhost on port 4007.
If the Localtonet client runs on another device, localhost would refer to that client device instead of the Phoenix host. In that arrangement, use a local IP address reachable from the client device and verify that route before creating the tunnel. Do not make the debugger listen broadly merely as a shortcut without considering the resulting local-network exposure.
Install and run the Localtonet client
Install our client for the operating system on the device that can reach LiveDebugger. Current installation details can vary by operating system and client release, so use the current Localtonet application or download workflow rather than copying an unverified command. Keep the client running for the duration of remote access.
Authenticate or select the client device
Use the device-specific authentication token associated with the client. Treat the token as a secret. Do not paste it into project files, shell history intended for sharing, issue reports, screenshots, or public documentation.
Select an available relay server
Choose a currently available server or region from the Localtonet dashboard. Available values can vary, so this guide does not hardcode a server code or claim that every location is available on every plan.
Create the HTTP tunnel configuration
Select an HTTP tunnel and enter the verified local target. Use the local IP address that is reachable from the client and port 4007 when LiveDebugger is using its documented default. HTTP tunnels can use Random Sub Domain, Custom Sub Domain, or Custom Domain process types, and each serves the content at a public HTTPS address. Use only the choices currently available to your account.
Start the tunnel
Creating a tunnel does not start it. Use the Start button and wait for the selected device and tunnel to be connected. The assigned public URL is usable only while the client remains connected and the tunnel remains running.
Test the assigned HTTPS URL
Open the assigned public address from the intended remote browser. Confirm that it reaches the same LiveDebugger interface tested locally, then exercise a non-sensitive development scenario to verify that the debugger and target LiveView remain functional.
Stop remote access when finished
Stop the tunnel after the debugging session. Delete it if it is no longer needed. Also stop LiveDebugger by shutting down the development application when the environment is not in use.
The Localtonet client makes an outbound connection to our relay, and the public address forwards traffic to the selected local service. This avoids inbound router configuration, but it does not change the sensitivity of the application being published. Anyone who can reach an insufficiently protected debugger URL may be able to observe development state exposed by the tool.
For the current dashboard sequence and field names, consult our Localtonet HTTP tunnel documentation . Use the live dashboard for current server choices and account-specific options rather than relying on screenshots or values from older tutorials.
| Layer | Address or role | Verification question |
|---|---|---|
| Phoenix application | The existing development application containing LiveView | Does the application start successfully using its normal development workflow? |
| LiveDebugger | http://localhost:4007 by default |
Can a browser in the host environment open the debugger and inspect an active LiveView? |
| Localtonet client | Device that can reach the local debugger endpoint | Can the selected client device reach the same local IP address and port? |
| Localtonet HTTP tunnel | Assigned public HTTPS URL | Is the tunnel started, and does its URL display the verified debugger interface? |
Security practices for remote LiveView debugging
A debugger is more sensitive than a normal public landing page. LiveDebugger can expose component structure, assigns, callback behavior, state transitions, and relationships between rendered elements and application components. Depending on the application and test data, those views may include personal information, tokens, internal identifiers, business state, or implementation details. The safest workflow is to minimize what is exposed, who can reach it, and how long it remains available.
Use a dedicated development environment
Keep the dependency restricted to :dev and run it only against a development instance. Do not point a development debugger at production data merely because the application process itself is local. Prefer synthetic or sanitized records that reproduce the issue without revealing customer information.
Use the narrowest practical access window
Start the tunnel only when the remote debugging session begins and stop it immediately afterward. A tunnel that is configured but stopped is not the same as an active public endpoint. Remember that creating the tunnel does not start it, and that deleting an obsolete tunnel removes accidental reuse from the workflow.
Do not publish credentials or device tokens
The Localtonet authentication token identifies the client device. It must not be embedded in the Phoenix repository, committed to version control, placed in examples, or shared with a collaborator as a substitute for access control. Likewise, remove sensitive values from screenshots, screen recordings, issue reports, and debugger demonstrations.
Apply available access controls
Use appropriate authentication, least-privilege access, IP restrictions, or other controls available for your current setup. Exact options can vary by configuration, plan, and product version, so confirm them in the current dashboard before depending on a specific control. A hard-to-guess URL alone should not be treated as authorization.
Review what the debugger displays
Before sharing remote access, inspect representative LiveViews locally. Look at assigns and callback data from the perspective of someone who should not know the application internals. If the debugger reveals secrets or unnecessary personal data, correct the development data and application behavior before opening the tunnel.
Outbound tunnel establishment removes the need for inbound router changes, but it does not make the resulting public URL private. Restrict access where supported, share the URL only with authorized participants, avoid production or sensitive data, monitor the active session, and stop the tunnel as soon as the work is complete.
Routine operation and troubleshooting
A practical session routine
- Start the Phoenix application in development mode.
- Open
http://localhost:4007and confirm that LiveDebugger works locally. - Start the Localtonet client on the device that can reach that endpoint.
- Start the existing HTTP tunnel.
- Open the assigned HTTPS URL from the remote browser.
- Perform the debugging task with sanitized development data.
- Stop the tunnel, then shut down the development application when finished.
The Igniter task is unavailable
Confirm that the terminal is in the correct Mix project and that Igniter is available to that project. The LiveDebugger evidence documents the installer command but does not establish one universal Igniter bootstrap command or version requirement. If the task cannot be made available using your project’s supported process, apply the documented manual dependency and root-layout changes instead.
The project no longer compiles after installation
Inspect the generated diff and the first relevant compiler error. Check for malformed list syntax in deps/0, a duplicate dependency, an expression inserted outside the root layout’s <head>, or an unresolved Igniter conflict. Restore the clean project state if necessary, then apply the two documented changes carefully.
The Phoenix application starts, but port 4007 does not respond
Verify that the application is actually running in the development environment and that the LiveDebugger dependency is present there. Recheck the root-layout expression and application logs. If the project intentionally customized LiveDebugger configuration, the endpoint may differ from the documented default. This article does not guess optional configuration keys or alternate defaults that were not established by the supplied evidence.
The interface opens, but expected browser features are absent
Confirm that the LiveDebugger tags expression is inside the root layout’s <head> and that the browser is rendering that root layout. The expression attaches the meta tag and scripts needed for the full browser experience. Also remember that a DevTools extension is optional and cannot replace the installed dependency.
Local access works, but the public URL does not
Check each layer in order. Confirm that the Localtonet client is connected, the correct device token is selected, the tunnel is started, and the local target uses the correct address and port. If the client runs in another container, virtual machine, or physical device, localhost:4007 may point to the wrong environment. Test reachability from the client’s location rather than only from your own browser.
The public URL reaches the wrong service
Recheck the tunnel’s local IP address and port. Port 4007 is LiveDebugger’s documented default, but another local process or project-specific configuration can change what is actually reachable. Stop the tunnel while correcting the target so that the unintended service is not left publicly accessible.
The tunnel was created but remains unavailable
Creation and execution are separate lifecycle states. Use the Start button after configuring the tunnel. The selected Localtonet client must also remain connected. If either the client disconnects or the tunnel stops, the public endpoint will not remain available.
A collaborator sees stale or incomplete state
First confirm that both browsers are looking at the intended development application and debugger instance. Reproduce the relevant interaction in the LiveView application, then inspect the component tree, assigns, and filtered callbacks again. If the application itself uses project-specific caches, background jobs, or external services, troubleshoot those according to the host project’s operation procedures.
Test the Phoenix application first, then the local LiveDebugger endpoint, then reachability from the Localtonet client device, and finally the public URL. This order prevents a local application failure from being misdiagnosed as a relay or tunnel problem.
Frequently asked questions
What command installs LiveDebugger with Igniter?
From the Phoenix project root, the documented command is mix igniter.install live_debugger. It is intended to add the LiveDebugger dependency and modify the application root layout automatically. Review the resulting diff and confirm that the dependency remains restricted to the development environment.
What is the default LiveDebugger URL?
After the Phoenix application starts, LiveDebugger runs by default at http://localhost:4007. Verify that URL locally before configuring remote access. If the project has deliberately customized its LiveDebugger configuration, use the configured endpoint instead.
Can I use LiveDebugger in production?
No. Its maintainers explicitly state that LiveDebugger should not be used in production. The dependency must be development-only through only: :dev. A Localtonet tunnel does not change that restriction.
Which Localtonet tunnel type should I use for LiveDebugger?
Use an HTTP tunnel because LiveDebugger provides a browser-based HTTP endpoint. Point it to the local IP address reachable from the Localtonet client and to port 4007 when the documented default is in use.
Does the Localtonet client have to run on the Phoenix host?
Not necessarily. It must run on a device that can reach the debugger endpoint. Running it in the same environment makes localhost:4007 the straightforward target. If it runs elsewhere, configure a reachable local IP address and verify connectivity from that client device before starting the tunnel.
Is the LiveDebugger browser extension enough by itself?
No. The main LiveDebugger dependency must be installed in the Mix project. The optional Chrome or Firefox extension enhances the DevTools workflow, but it does not replace the dependency, root-layout integration, running Phoenix application, or debugger endpoint.
Does creating a Localtonet tunnel make it immediately available?
No. Creating and starting are separate lifecycle actions. After configuration, use the Start button. The tunnel remains available only while the selected client is connected and the tunnel is running.
Do I need router port forwarding or a public IP address?
No. The Localtonet client establishes an outbound connection to our relay server, so this workflow does not require inbound router port forwarding, a public IP address, firewall changes, or VPN setup. You still need to protect the resulting public endpoint and comply with the policies governing the development environment.
Open your verified LiveDebugger endpoint with Localtonet
Install LiveDebugger as a development-only dependency, confirm the interface locally at port 4007, then create a temporary Localtonet HTTP tunnel for authorized remote debugging. Stop the tunnel as soon as the session is complete.
Get Started Free →