

Find where capable AI models may be handling work that does not require them
Request totals and token counts can show that AI usage is growing, but they cannot explain whether the growth comes from valuable complex work, inefficient agents, broad default-model selection, provider retries, or repeated attempts to complete simple tasks. This stack-neutral architecture guide shows how to connect gateway traffic to actors, applications, tasks, conversations, model decisions, cost, and outcomes. It defines implementation prerequisites, OpenTelemetry-aligned telemetry, acceptance criteria, verification procedures, and operational safeguards without pretending that one installation command works across every gateway and observability stack. It also explains how a Localtonet HTTP tunnel can make an authenticated local dashboard remotely reachable while keeping AI analytics separate from tunnel connectivity.
📋 What's in this guide
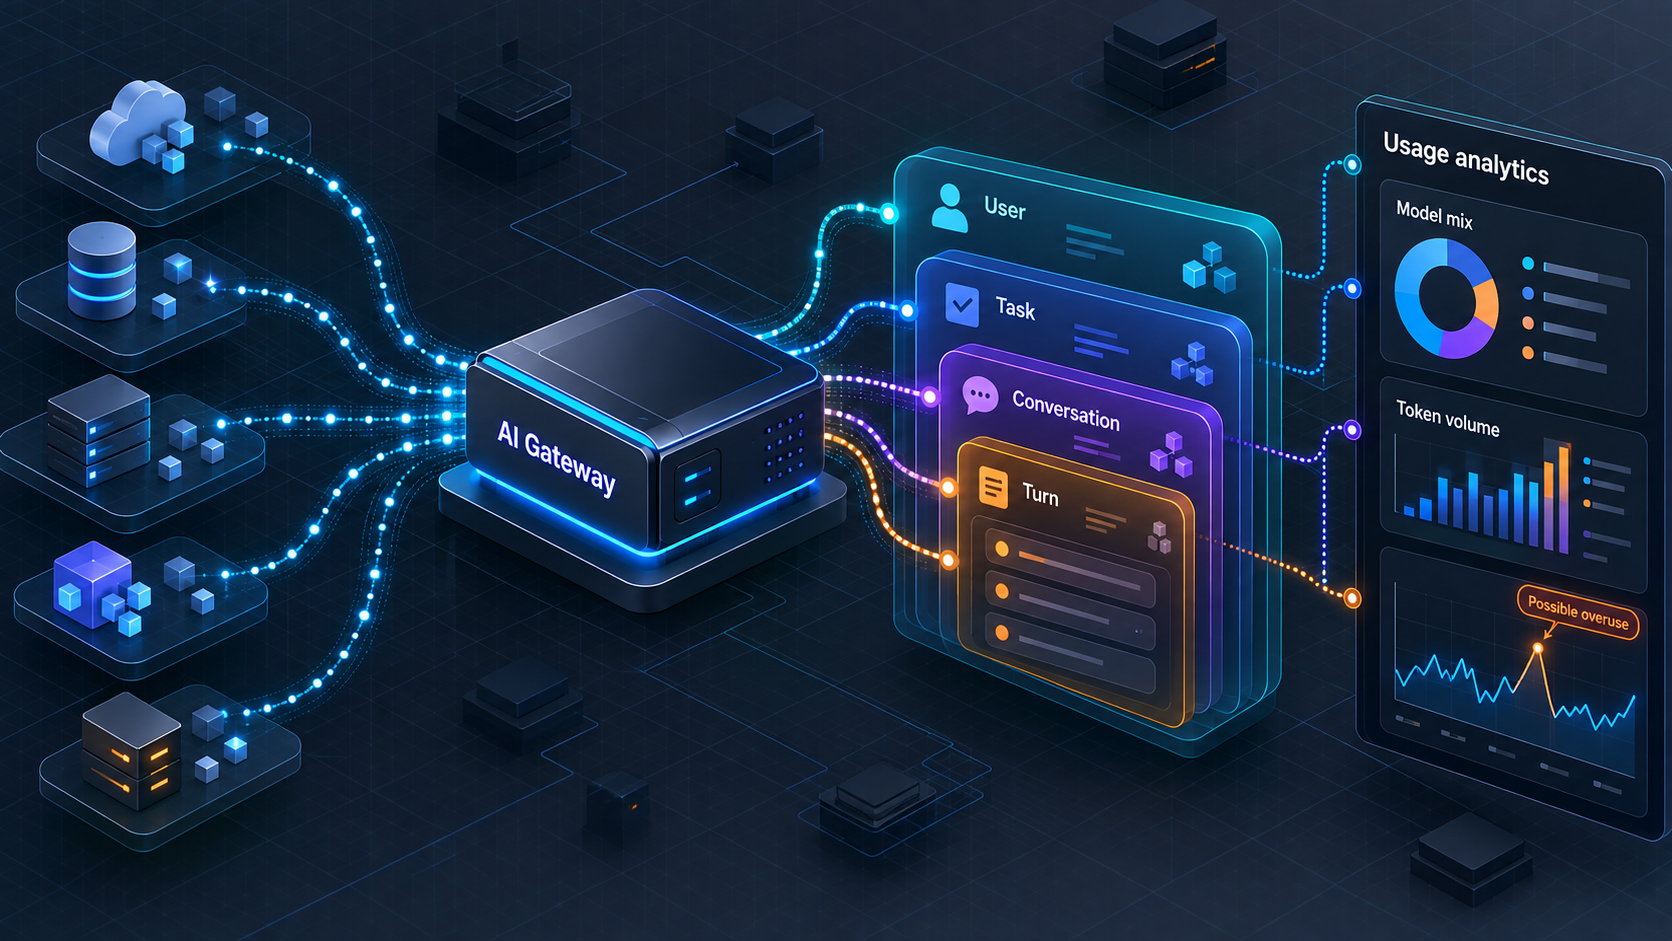
What this stack-neutral guide does and does not implement
This article is an architecture and evaluation guide for teams that already operate, or plan to operate, an AI gateway. It does not select a particular gateway, OpenTelemetry Collector distribution, telemetry database, or dashboard product. That is deliberate: installation commands, configuration syntax, default ports, exporters, authentication settings, and query languages differ materially between maintained projects.
Instead, the guide defines the interfaces that a complete implementation must provide. It gives you an event flow, standards-aligned attribute mapping, organization-specific extension fields, implementation sequence, startup checklist, test cases, acceptance criteria, dashboard requirements, and troubleshooting workflow. You can apply those requirements to a gateway with native OpenTelemetry support, gateway middleware that creates spans and metrics, or an application-side adapter that enriches gateway records before export.
You must obtain exact installation, startup, exporter, storage, authentication, and query instructions from the maintained documentation for the gateway and observability stack you select. Do not assume that example ports, environment variables, metric names, or configuration files from another project apply to yours. This guide tells you what the assembled system must do and how to verify it.
The article also does not define “model overuse” as a universal technical condition. A model that looks excessive for a short prompt may still be required for accuracy, structured-output reliability, language coverage, context capacity, safety behavior, tool selection, or consistent task completion. Overuse signals should identify cohorts for evaluation, not automatically downgrade requests or rank employees.
The Localtonet section has a similarly narrow boundary. Our HTTP tunnel can provide a public HTTPS address for a local web dashboard without inbound router port forwarding, firewall changes, VPN setup, or a public IP address. Localtonet does not create semantic task classifications, calculate model quality, infer user intent, or decide that a model is overused. Those responsibilities remain in the application, gateway, evaluator, and telemetry pipeline.
Why aggregate usage is not enough
Aggregate request and token charts remain useful. They reveal traffic growth, output spikes, changing model distribution, latency shifts, and cost movement when pricing data is reliable. The same totals, however, can represent very different situations. A sustained research workflow may legitimately use a capable reasoning model and several turns. A formatting endpoint may send hundreds of requests to that model simply because it is the application default. One agent action may also produce planning, retrieval, tool-selection, verification, and final-answer calls.
The practical objective is to find repeatable patterns. A team might discover that one application routes all summarization and formatting work to its most capable model, most conversations finish in one turn, and an approved alternative performs equally well on representative evaluations. That is a defensible routing candidate. A multi-turn debugging conversation that produces a verified patch may be operating exactly as intended.
Prerequisites for a credible observability workflow
Do not begin with dashboard charts. First confirm that the selected components can provide the information needed to make those charts meaningful. If one prerequisite is unavailable, document the limitation and avoid presenting affected calculations as complete.
| Prerequisite | Required capability | Acceptance question |
|---|---|---|
| Gateway hooks or middleware | Observe logical requests, routing decisions, downstream attempts, responses, errors, retries, and streaming completion. | Can one synthetic request be traced from the gateway entry point to every provider attempt? |
| Authenticated actor context | Provide a controlled user, service, or agent reference from the application’s authenticated context. | Can analysts distinguish people, services, and agents without using an IP address as identity? |
| Correlation identifiers | Carry trace, request, task, conversation, session, and agent-run relationships across components. | Can all calls created by one task be joined without matching prompt content? |
| Telemetry transport | Export spans, metrics, logs, or normalized events with bounded retries and observable delivery failures. | Can operators detect rejected, delayed, duplicated, or dropped telemetry? |
| Storage and query system | Retain required dimensions, support task-level aggregation, and distinguish missing data from zero. | Can it query request, attempt, conversation, and task scopes separately? |
| Dashboard access controls | Authenticate users, authorize views, restrict raw records, and protect exports and administrative routes. | Does a least-privileged account see only the intended aggregates? |
| Outcome signals | Join validation, acceptance, test, regeneration, escalation, or completion evidence to the originating task. | Can a routing comparison measure quality rather than cost alone? |
| Pricing provenance | Version prices by provider, model, effective time, currency, and applicable organizational terms. | Can every calculated cost identify the pricing record used? |
| Representative evaluation data | Cover normal cases, difficult examples, edge cases, safety-sensitive inputs, and expected failure modes. | Would the test set reveal a quality regression hidden by average token savings? |
Gateway and middleware requirements
A conventional access log is not sufficient. The integration needs a hook before routing, after routing, around each downstream attempt, and after the final logical result. For streaming responses, it should also observe when the first output arrives and when the stream finishes or fails. If the gateway lacks these hooks, instrument an application adapter or middleware layer that can preserve the same relationships.
Decide whether telemetry export is synchronous or asynchronous. Blocking the model response on analytics delivery can add latency and create a new failure mode. An asynchronous path is usually operationally safer, but it needs buffering, bounded retry behavior, backpressure handling, delivery-health metrics, and a documented policy for what happens when the telemetry destination is unavailable.
Identity and correlation requirements
Identity should originate from an authenticated application context. Network addresses, user-agent strings, and client-supplied labels are not reliable identity on their own. Use pseudonymous identifiers where possible, distinguish human actors from service accounts and agents, and keep any re-identification mapping in a more restricted system.
Correlation identifiers must have documented scopes. A trace ID can follow one distributed operation, a gateway request ID can represent one logical gateway invocation, an attempt ID can represent one provider call, a conversation ID can span several exchanges, and a task or agent-run ID can group all work needed for an outcome. Do not use one overloaded “request ID” for all of these concepts.
Outcome and evaluation requirements
Outcome data is frequently delayed. A response can be returned before a unit test runs, a user accepts an edit, or a workflow completes. The system therefore needs either an update mechanism or a separate outcome event that joins to the original task. Record when the evaluation occurred, which evaluator or rule produced it, and which version of that evaluator was used.
Evaluation data must resemble actual workloads. A small set of easy prompts can make a cheaper model appear equivalent while hiding failures on long context, ambiguous instructions, structured outputs, specialized languages, tool use, or safety-sensitive cases. Protect evaluation fixtures using the same privacy rules that apply to production data.
Separate the request, telemetry, analytics, and connectivity layers
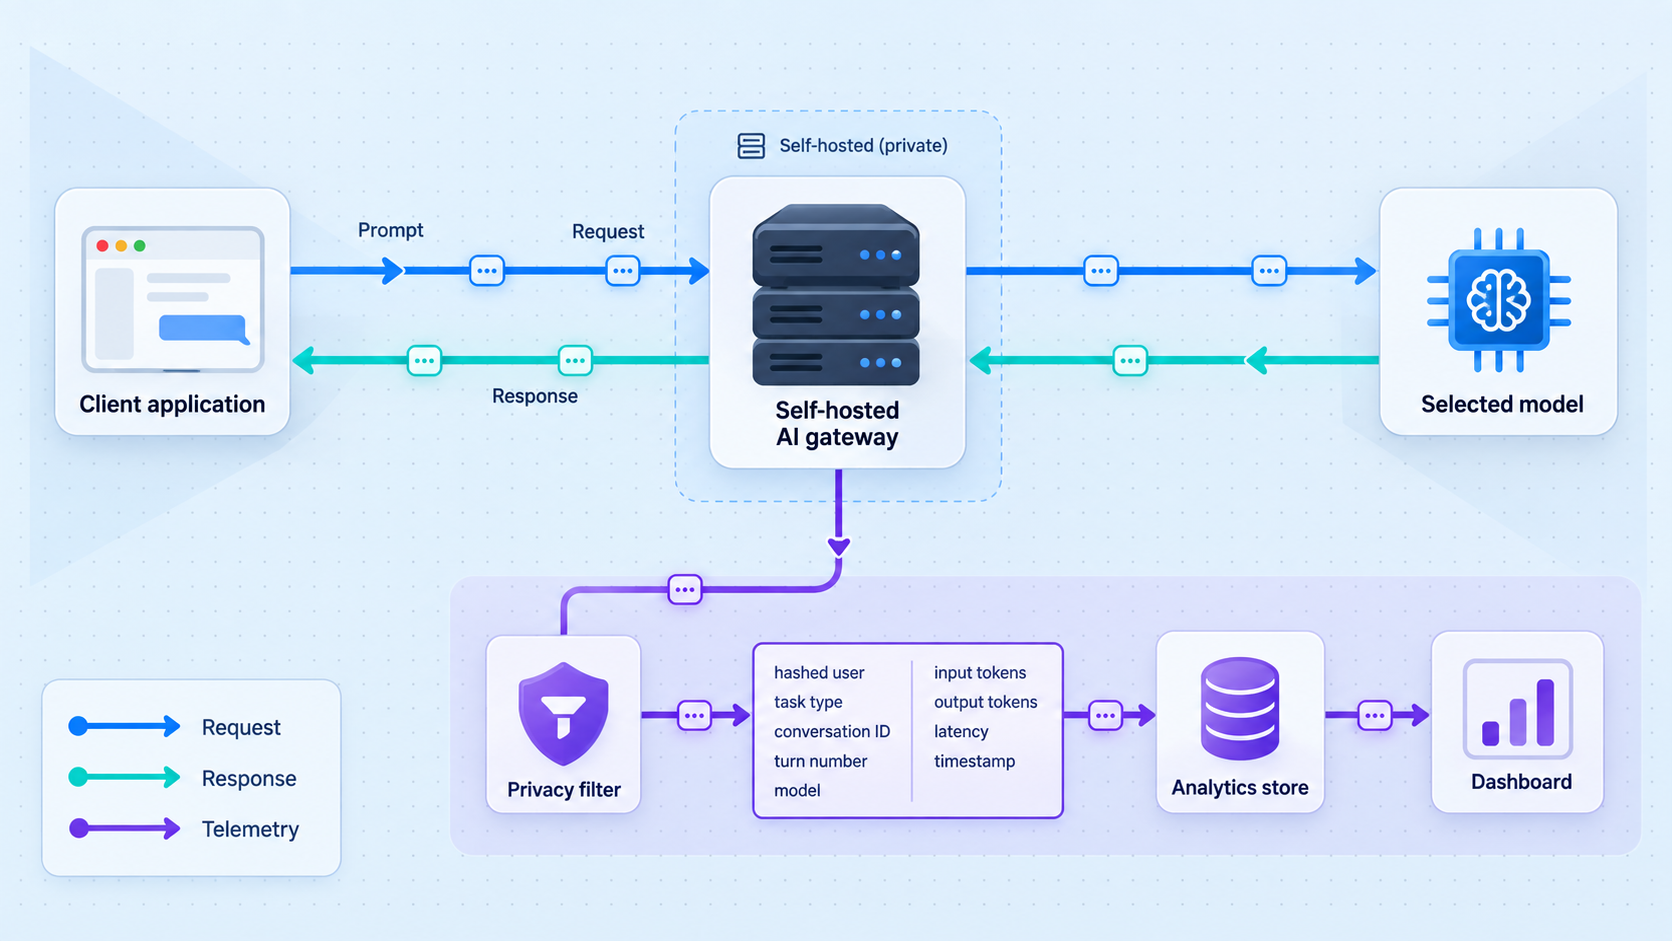
A clean design separates the data plane that processes model requests, the telemetry path that observes those requests, the analytics system that aggregates them, and the connectivity layer that provides approved remote access. Each layer has a different responsibility and should have independent health checks.
| Layer | Primary responsibility | Typical data | Important boundary |
|---|---|---|---|
| AI application or agent | Initiates work and supplies business context | Actor reference, task, conversation, agent run, requested model, outcome | It does not automatically know the gateway’s final route or every provider attempt. |
| AI gateway | Accepts requests, applies routing, calls model endpoints, and returns results | Selected model, route policy, status, timing, retries, provider-reported usage | It cannot reliably infer authenticated identity or business outcomes when the application omits them. |
| Telemetry transport | Buffers and exports observability signals | Spans, metrics, logs, delivery failures, queue health | It should not silently convert unknown values to zero or discard rejected records without a signal. |
| Storage and analytics | Normalizes, retains, aggregates, and queries telemetry | Request, attempt, conversation, task, cost, quality, and coverage views | It is not an infallible judge of task complexity or model suitability. |
| Dashboard | Presents trends and supports authorized investigation | Filters, distributions, drill-downs, model-fit candidates, telemetry health | A dashboard does not replace controlled evaluation or application authorization. |
| Localtonet HTTP tunnel | Makes an approved local web service reachable through a public HTTPS address | Local target, selected device, relay server, public address, tunnel state | Localtonet does not generate semantic AI analytics from gateway traffic. |
Implementation-neutral event flow
The following pseudocode describes behavior, not a copy-and-paste API. Replace each operation with the hooks, SDK calls, middleware interfaces, and exporters supported by your selected stack.
on authenticated application request:
  create or propagate trace_id
  create logical_request_id
  attach pseudonymous actor, application, task, conversation, and agent_run context
  start a gateway client span

before routing:
  record requested model and operation type

after routing:
  record selected model, provider, route rule, policy version, and fallback state

for each downstream provider attempt:
  create a child attempt span
  record attempt number and retry reason when applicable
  record request start time
  if response streams:
    record time to first output
  record completion time, status, response model, and provider response identifier
  record provider-reported input and output token usage with provenance
  end the attempt span

after the logical gateway result:
  record final status and total logical duration
  emit bounded metrics with low-cardinality dimensions
  export telemetry asynchronously according to the stack's delivery policy

when an outcome becomes available:
  emit or update an outcome record linked by task and logical_request identifiers
  include evaluator type, evaluator version, result, and evaluation time
Keep high-cardinality values such as request IDs, conversation IDs, and pseudonymous user references on traces or controlled event records rather than using them as metric labels. Metrics indexed by unbounded identifiers can become expensive and difficult to operate. Use metrics for bounded dimensions such as operation, provider, model, status, application class, and approved task category, subject to the capabilities and cardinality limits of your telemetry backend.
Align telemetry with OpenTelemetry generative AI conventions
OpenTelemetry provides generative AI semantic conventions for traces and metrics. The conventions evolve, and some elements may have different stability levels depending on the version implemented by your SDK or collector. Pin a semantic-convention version in your implementation documentation, use the names supported by that version, and plan explicit migrations rather than silently renaming production attributes.
Common convention-aligned concepts include the generative AI operation, provider, requested model, response model, response identifier, conversation identifier, token usage, and client operation duration. Examples of attribute names used in current generative AI conventions include gen_ai.operation.name, gen_ai.provider.name, gen_ai.request.model, gen_ai.response.model, gen_ai.response.id, gen_ai.conversation.id, gen_ai.usage.input_tokens, and gen_ai.usage.output_tokens. Confirm exact availability and stability against the OpenTelemetry version adopted by your stack.
Reuse OpenTelemetry generative AI attributes when their semantics match. Keep organization-specific task, actor, route-policy, pricing, retention, and outcome fields in a clearly documented custom namespace. Do not relabel a business-specific value as a standard attribute merely because the names look similar.
| Concept | OpenTelemetry-aligned field where applicable | Organization-specific extension |
|---|---|---|
| Operation | gen_ai.operation.name |
Custom workflow step only if the standard operation does not express the business stage. |
| Provider | gen_ai.provider.name |
Internal endpoint or deployment reference, if approved and needed. |
| Requested model | gen_ai.request.model |
Route-rule reference and route-policy version. |
| Actual response model | gen_ai.response.model |
Fallback reason or organization-specific deployment tier. |
| Provider response | gen_ai.response.id |
Internal attempt identifier for joining retries. |
| Conversation | gen_ai.conversation.id when supported by the adopted convention |
Task ID and agent-run ID, whose scopes must be documented separately. |
| Token usage | gen_ai.usage.input_tokens and gen_ai.usage.output_tokens |
Usage source, estimation method, and missing-data reason. |
| Actor and task | No generative AI attribute should be assumed to cover all business identity and task semantics. | Pseudonymous actor, actor type, application, team, task category, and classification method. |
| Quality and cost | Use supported standard measurements where they match, but do not assume a universal quality or contractual-cost schema. | Evaluator, validation result, pricing record, calculated cost, and currency. |
Illustrative normalized event
The following JSON is an organization-level normalized record. It is not an OpenTelemetry standard schema, a Localtonet configuration, or a requirement for a particular gateway. The otel object illustrates how convention-aligned concepts can be preserved, while the other objects contain custom fields that must be defined and governed by the organization.
{
  "schema_version": "organization-defined-version",
  "event_id": "generated-event-identifier",
  "occurred_at": "timestamp",
  "otel": {
    "trace_id": "trace-identifier",
    "span_id": "span-identifier",
    "gen_ai.operation.name": "chat",
    "gen_ai.provider.name": "provider-name",
    "gen_ai.request.model": "requested-model",
    "gen_ai.response.model": "response-model",
    "gen_ai.response.id": "provider-response-identifier",
    "gen_ai.conversation.id": "conversation-reference",
    "gen_ai.usage.input_tokens": null,
    "gen_ai.usage.output_tokens": null
  },
  "actor": {
    "actor_ref": "pseudonymous-reference",
    "actor_type": "user",
    "team_ref": "team-reference",
    "application_ref": "application-reference",
    "agent_ref": null
  },
  "work": {
    "task_ref": "task-reference",
    "agent_run_ref": null,
    "task_category": "summarization",
    "classification_method": "application-supplied",
    "turn_number": 1
  },
  "routing": {
    "route_rule_ref": "routing-rule-reference",
    "route_policy_version": "policy-version",
    "fallback_used": false,
    "fallback_reason": null
  },
  "measurement": {
    "logical_duration_ms": 0,
    "time_to_first_output_ms": null,
    "attempt_count": 1,
    "usage_provenance": "provider-reported"
  },
  "cost": {
    "amount": null,
    "currency": null,
    "pricing_record_ref": null,
    "calculation_status": "unknown"
  },
  "outcome": {
    "status": "completed",
    "validation_passed": null,
    "evaluator_ref": null,
    "evaluator_version": null
  },
  "privacy": {
    "prompt_stored": false,
    "response_stored": false,
    "retention_class": "operational-analytics"
  }
}
Token, retry, streaming, and cost semantics
Preserve token provenance. A provider or model server may report usage directly, an integration may estimate usage, or usage may be unavailable. Store the source and estimation method. Never mix estimated and provider-reported values without making that difference queryable, and never turn missing usage into zero.
Preserve both logical requests and downstream attempts. A retry is not necessarily a second user action. Operations teams need attempt-level visibility to diagnose provider failures, while product teams need logical task totals. Record the retry trigger when known, such as timeout, rate response, connection error, invalid output, or application-directed retry. Do not infer a reason that the gateway cannot observe.
Streaming latency needs at least two definitions: time to first output and total completion time. Time to first output captures perceived responsiveness, while total duration captures the complete resource and waiting cost. Also record interrupted streams and partial results where the selected stack can observe them.
Cost should be calculated from a versioned pricing record tied to provider, model, effective time, currency, and applicable organizational terms. Public pricing may not match a private contract. Label calculated cost as estimated unless it is reconciled with authoritative billing data. When reliable pricing is unavailable, retain token and request measurements and mark cost unknown.
Implement the observability workflow
The following sequence is independent of a particular product. Complete each stage using the official configuration mechanism of your chosen gateway, telemetry transport, storage system, and dashboard.
Define decisions and measurement scopes
Document the questions telemetry must answer and define request, provider-attempt, turn, conversation, agent-run, and task scopes. State what evidence is required before changing a route.
Create authenticated context and identifiers
Generate or propagate pseudonymous actor, application, task, conversation, request, and agent-run references at the application boundary. Keep credentials and direct personal data out of identifiers.
Instrument gateway operations and attempts
Create spans or equivalent records around the logical gateway operation and each downstream attempt. Record requested and selected models, provider, status, route policy, fallback, and retry details.
Capture usage and latency with provenance
Record provider-reported token usage where available, distinguish estimates, and preserve unknowns. For streaming, measure both time to first output and total completion time.
Attach task and outcome context
Add a documented task category and classification method. Join validation, completion, user acceptance, regeneration, escalation, or other quality evidence when it becomes available.
Export, validate, and retain telemetry
Configure the selected transport, validate required fields and schema versions, observe delivery health, quarantine malformed records, and enforce purpose-based retention.
Create explicit aggregate views
Build separate request, attempt, conversation, and task aggregates. Include coverage indicators so incomplete instrumentation is visible beside every model-fit analysis.
Verify with controlled test traffic
Exercise success, retry, failure, streaming, multi-turn, fallback, and delayed-outcome paths using non-sensitive fixtures. Confirm each relationship before relying on production charts.
Track telemetry quality as a first-class metric
Measure missing actor references, unknown task categories, absent token counts, unjoined outcomes, duplicate records, delayed exports, out-of-order turns, rejected records, and schema-version distribution. A dashboard can show precise percentages over incomplete data and still be misleading. Display coverage and sample size beside model comparisons.
Also monitor the observability pipeline itself. Useful operational signals include export queue depth, export failure count, retry age, dropped-record count, storage ingestion delay, dashboard query errors, and the age of the latest complete interval. Exact metric names depend on the selected transport and storage stack.
Detect possible model overuse without oversimplifying it
The strongest signal combines task type, model selection, total task consumption, latency, attempts, conversation behavior, and outcome quality. No single metric establishes that a model is unnecessary. Build a candidate view that keeps these dimensions visible and allows authorized operators to inspect the underlying workflow.
Compare cohorts, not unrelated requests
Group comparable work by application, task category, route policy, input-size band, expected output type, and time period. A model can appear inefficient simply because it receives harder work. Within a cohort, examine medians, tail distributions, sample sizes, distinct actors, completion outcomes, and instrumentation coverage instead of relying only on averages.
| Signal | Possible interpretation | Required follow-up |
|---|---|---|
| Routine task category with a highly capable model | A broad default route may be applying more capability than the workflow appears to require. | Compare approved alternatives using representative quality and reliability evaluations. |
| Many turns for bounded work | The prompt, interaction design, model, tool path, or agent loop may not complete the task directly. | Inspect corrections, validation failures, tool errors, and the purpose of each turn. |
| High output usage for a constrained response | Instructions or output controls may be too loose. | Check expected length, truncation, structured-output validation, and acceptance. |
| One agent dominates an increase | A specialized workload, schedule, stopping-condition problem, or retry loop may be concentrated in one actor. | Review task outcomes, attempt relationships, schedules, and loop controls. |
| Requested and selected models differ | A route policy or fallback may be changing the application’s intended model. | Inspect policy version, provider health, fallback reason, and response model. |
| Low request cost but poor task completion | A cheaper route may create retries, follow-up turns, escalations, or abandoned work. | Compare complete task cost and quality rather than the first call alone. |
Calculate the full task trajectory
A useful task aggregate includes every related model attempt, input and output usage, time to first output, total duration, retries, validation calls, tool-related model calls, and follow-up turns. If a lower-priced model requires repeated corrections while another completes the task once, per-request cost can point in the wrong direction.
Long conversations are not automatically wasteful. Research, debugging, and collaborative writing can require sustained interaction. The more actionable pattern is repeated multi-turn behavior in a narrowly defined cohort with a bounded expected result. Even then, investigate ambiguity, missing context, prompt design, tool failures, routing, and application behavior before blaming the model.
Evaluate before changing routes
Build a representative test set for the candidate cohort. Compare the current model and approved alternatives on application-specific quality, completion rate, latency, total task tokens, retries, structured-output success, safety requirements, and known edge cases. Record model and evaluator versions so the result can be reproduced.
If the application supports controlled rollout, begin with a limited cohort and preserve a safe fallback for detectable failures. Monitor quality coverage, fallback frequency, regenerations, escalations, and user feedback. A successful routing change is not merely cheaper. It must preserve the outcome required by the application.
Actor-level visibility can reveal application defaults, training needs, automation loops, or compromised credentials, but raw consumption is not a fair measure of performance. Restrict access, preserve workload context, document the purpose, and evaluate systems and workflows rather than making unsupported judgments about individuals.
Start and verify the selected stack
Exact commands depend on the products you choose. Use each project’s maintained documentation to install and start the gateway, telemetry transport, storage system, and dashboard. Before production use, complete the following implementation-neutral startup and verification procedure.
Startup checklist
- Start the telemetry storage system and confirm that it accepts authenticated ingestion from the approved transport.
- Start the collector, exporter, or equivalent telemetry transport and confirm that its configuration validates successfully.
- Start the dashboard or query interface and confirm that application authentication and authorization are active.
- Start the gateway with the intended instrumentation, exporter endpoint, schema version, and privacy controls.
- Start the AI application or test client with actor, task, conversation, and request correlation enabled.
- Verify clock synchronization across components because incorrect timestamps can break duration calculations and joins.
- Confirm that the telemetry failure policy is understood. A telemetry outage must not silently create an uncontrolled memory queue.
End-to-end verification matrix
| Test | Expected observation | Failure indication |
|---|---|---|
| Single successful request | One logical operation, one attempt, correct actor and task context, selected model, status, timing, and available usage. | Missing joins, zero substituted for unknown usage, or inconsistent identifiers. |
| Provider retry | One logical request with multiple child attempts and a recorded retry reason when known. | Retries appear as unrelated user requests or disappear from task cost. |
| Streaming response | Time to first output and total duration are distinct, with interrupted streams represented accurately. | Only one ambiguous latency value or a successful status for an interrupted stream. |
| Multi-turn conversation | Turns remain distinct but share conversation and task relationships. | Each turn becomes an unrelated conversation or turn ordering is lost. |
| Routing fallback | Requested model, selected or response model, route policy, fallback state, and reason are visible where available. | The final model appears without evidence of how it was selected. |
| Delayed outcome | A later validation or acceptance record joins to the original task with evaluator provenance. | The outcome is orphaned or overwrites historical routing facts. |
| Telemetry destination unavailable | Delivery failures, bounded retries, queue health, and drop behavior are observable. | Gateway instability, unbounded buffering, or silent data loss. |
| Unauthorized dashboard user | Restricted views, raw records, exports, and administration remain inaccessible. | A public or low-privilege account can retrieve sensitive telemetry. |
Acceptance criteria
The workflow is ready for an initial controlled deployment when known test traffic can be traced across all required scopes, retries are not counted as separate user actions, streaming measurements have explicit meanings, token provenance is retained, delayed outcomes join correctly, telemetry loss is visible, cost identifies its pricing source, and dashboard permissions pass least-privilege tests.
It is not ready for model-fit decisions if task categories are mostly unknown, quality outcomes are absent, model values cannot distinguish requested from selected behavior, or substantial applications have incomplete instrumentation. In that situation, use the dashboard for operational debugging while clearly labeling model-overuse findings as incomplete.
Protect prompts, identities, telemetry, and dashboards
AI telemetry can be more sensitive than ordinary service metrics. It may reveal what individuals are working on, which repositories or customers are involved, internal model choices, security investigations, and how agents are configured. Minimize collection before attempting to secure a larger dataset.
- Prefer metadata over content: Store task category, token counts, model, route, outcome, and pseudonymous references when those fields answer the operational question.
- Separate identity mapping: Keep re-identification data outside general analytics storage and restrict it to approved roles.
- Redact before export: Remove secrets and unnecessary personal or business data before telemetry reaches broadly accessible storage.
- Set purpose-based retention: Request-level debugging records may need shorter retention than aggregated trends. Enforce deletion rather than relying on policy documents alone.
- Restrict raw-event access: Most users may need aggregate dashboards only. Limit prompts, responses, actor-level records, and trace details to approved investigators.
- Protect exports: CSV files, notebooks, screenshots, and downloaded traces can escape dashboard controls. Apply the same handling rules as the underlying data.
- Audit important changes: Record changes to routing policy, evaluator versions, task classification, pricing records, retention, and dashboard permissions.
Prompts and responses can contain personal data, source code, customer records, internal URLs, secrets, or regulated information. If content capture is genuinely required, apply redaction, explicit authorization, limited retention, access auditing, and organizational review appropriate to the data.
Separate the gateway’s inference endpoint from analytics and administration where the chosen software permits it. These surfaces can have different users, authentication requirements, exposure policies, and availability expectations. Database listeners, telemetry ingestion ports, provider credentials, and administrative APIs should not be exposed merely because remote users need a dashboard.
Build dashboards that lead to reviewable decisions
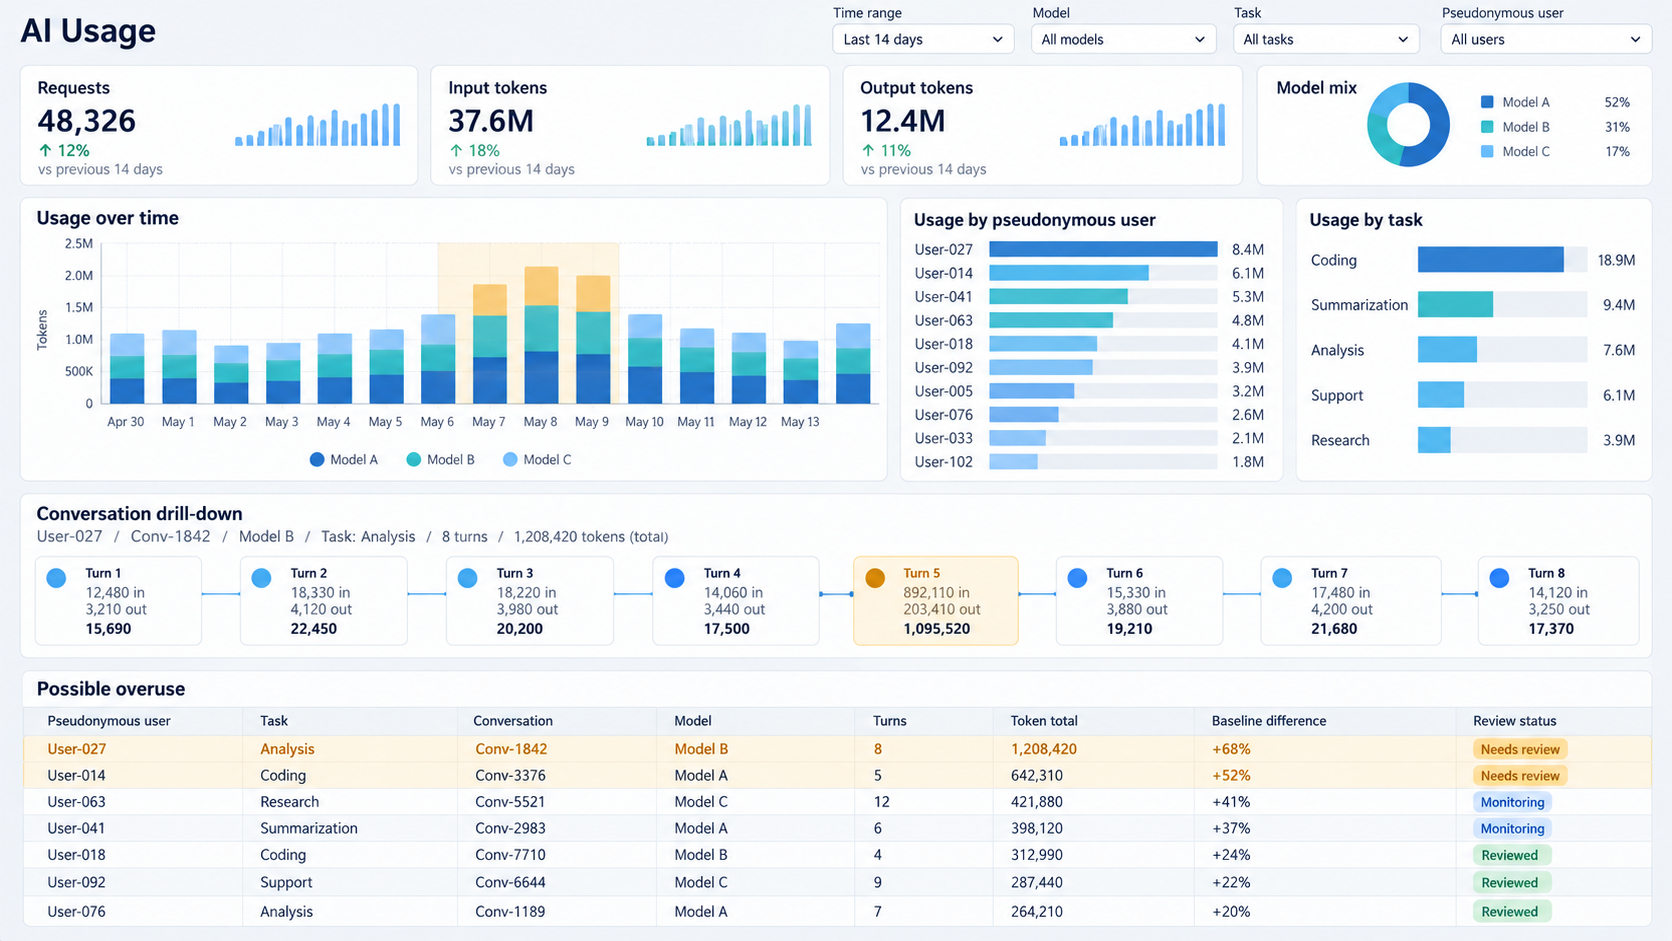
A useful dashboard moves from broad change detection to a comparable cohort, then to evidence for an evaluation. It should not jump directly from a cost spike to an automatic model replacement.
- Usage overview: Logical requests, attempts, tasks, conversations, input and output usage, latency, errors, and cost where pricing is reliable.
- Model distribution: Requested, selected, and response models by application, task, actor type, route policy, and time.
- Task analysis: Model mix, completion outcomes, turns, attempts, usage, and latency per completed task.
- Conversation analysis: Turn distribution, retries, provider attempts, and time from initial request to final outcome.
- Candidate review: Routine cohorts using capable models, accompanied by quality coverage, sample size, and alternative-evaluation status.
- Actor concentration: Users, services, and agents associated with unusual changes, without presenting consumption as a performance ranking.
- Routing audit: Requested versus selected models, fallback behavior, route-policy version, and configuration changes over time.
- Telemetry health: Missing identifiers, unknown tasks, absent usage, delayed outcomes, duplicate events, export failures, and schema versions.
Label every chart with its unit and scope. “Requests per user” can mean application actions, gateway operations, provider attempts, or agent subcalls. Display sample size and instrumentation coverage so a dramatic percentage based on a handful of incomplete events does not look equivalent to a stable cohort.
Make an authenticated dashboard reachable with Localtonet
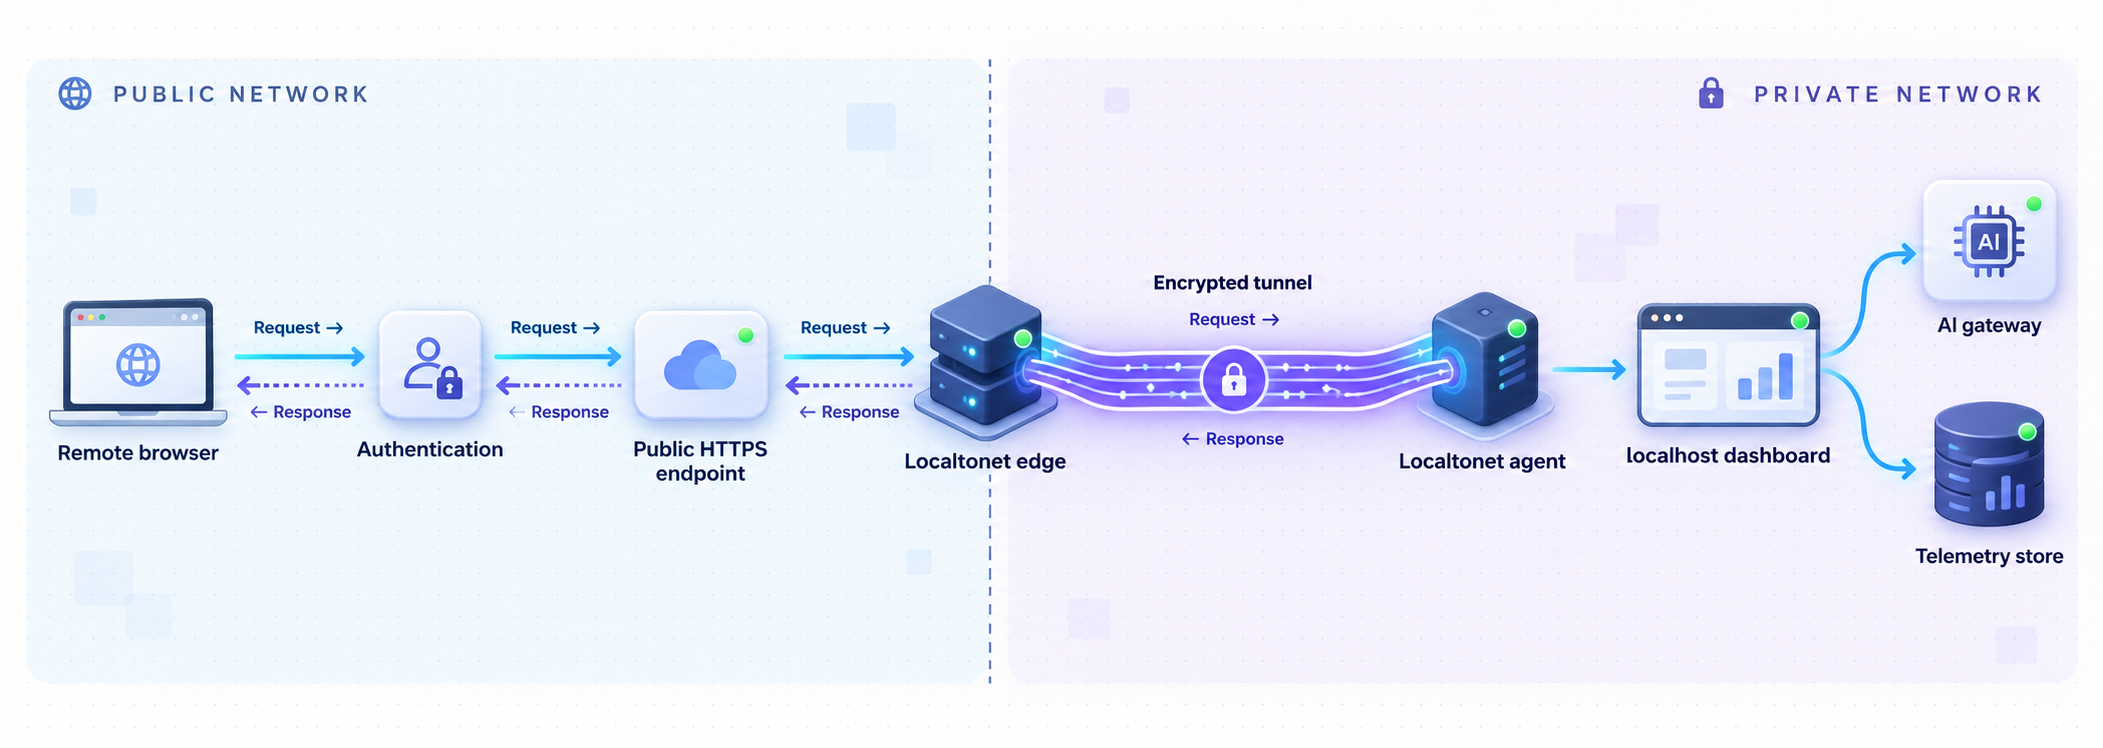
First verify the dashboard locally, including its authentication and least-privilege roles. Then an HTTP tunnel can make that local web service reachable through a public HTTPS address. The Localtonet client on the device establishes an outbound connection to our relay server, so the workflow does not require inbound router port forwarding, firewall changes, VPN setup, or a public IP address.
The documented Localtonet actions are installing and running the client, selecting the device through its authentication token, choosing a currently available relay server, creating the HTTP tunnel with the correct local target and process type, and starting it. Security testing, local application verification, and remote authorization checks are recommended operational controls, not Localtonet dashboard fields.
Install and run the Localtonet client
Install the Localtonet application for the operating system on a device that can reach the dashboard. Keep the client connected while remote access is required. Use the current installation flow for your operating system and client version.
Authenticate and select the device
Use the device-specific authentication token through the supported Localtonet workflow, then select the device that will run the tunnel. Treat the token as a credential and never publish or guess it.
Select an available relay server
Choose a currently available server or region from the dashboard. Obtain current values from the product instead of copying a hardcoded server code from an article.
Create the HTTP tunnel
Enter the local IP address and port where the dashboard is reachable from the client device. Select Random Sub Domain, Custom Sub Domain, or Custom Domain as the process type, subject to current availability. All three process types serve the target through a public HTTPS address. Check current documentation before configuring custom-domain DNS.
Start the tunnel
Creating a tunnel does not start it. Use the Start button and open the assigned public HTTPS address. The endpoint is available only while the selected client is connected and the tunnel is running.
For current interface details, see the Localtonet HTTP tunnel documentation. Exact options can vary by plan, client version, region, or deployment, so verify availability in the current dashboard.
Protect the dashboard with application authentication and least-privilege authorization. Do not rely on an obscure URL. Test with a restricted account, expose only the required web surface, and stop or delete the tunnel when remote access is no longer needed.
Verify the target before starting remote access
From the device running the Localtonet client, open the exact local address and port configured as the tunnel target. Confirm that authentication appears before sensitive content and that a least-privileged account cannot open raw events, exports, settings, or administrative routes. If the dashboard runs in a container, virtual machine, or another LAN host, the client device must be able to reach that address directly.
Target only the dashboard service. Do not expose the telemetry collector, storage database, model-provider credentials, or a broader administrative interface. After starting the tunnel, test the public address from an approved remote device. Stop the tunnel immediately if authentication is missing or permissions differ from local behavior.
Troubleshoot telemetry, analysis, and remote access
The dashboard loads, but task or model data is missing
This is usually an instrumentation or analytics issue, not a tunnel issue. Verify that the application supplies correlation context, the gateway records routing fields, the exporter accepts the active schema version, and the dashboard time range includes the test event. Inspect rejected-event, unknown-category, export-failure, and ingestion-delay signals.
Request totals are much higher than expected
Determine whether the chart counts logical application actions, gateway operations, downstream attempts, retries, or agent subcalls. Trace one controlled conversation. Internal calls can be legitimate, but they should roll up to the correct agent run and task.
Token totals are zero or inconsistent
Check whether the provider returns usage for the selected operation and whether streaming usage is available through that integration. Confirm that missing values remain unknown. Inspect usage provenance before comparing integrations that report tokens differently or rely on estimation.
Latency looks good even though users report slow responses
Confirm which latency is displayed. Provider processing time, gateway operation duration, time to first output, stream completion time, and complete task duration answer different questions. For agent workflows, include tool waits, retries, and follow-up calls when measuring the user-visible task.
Cost totals disagree with billing
Check missing usage, duplicate telemetry, retries, cached responses, time boundaries, pricing effective dates, model aliases, currency, and private commercial terms. Keep calculated cost labeled as an estimate until it is reconciled with authoritative billing data.
A model appears overused, but quality data is unavailable
Treat the cohort as a candidate only. Add a suitable outcome signal and run a controlled comparison. If direct quality measurement is unavailable, document the proxy and its limitations. Lower token use or price does not establish equivalent output.
Telemetry disappears during collector or storage outages
Inspect exporter failures, queue depth, retry age, backpressure, and dropped-record counters. Verify that retry and buffering are bounded. The exact recovery controls depend on the selected telemetry stack, but silent loss and unbounded memory growth are both unacceptable operational states.
The dashboard works locally but not through Localtonet
Confirm that the selected Localtonet device is connected, the tunnel has been started, and the local target matches the verified dashboard address and port. Test the target from the same device running the client. If that device cannot reach the service locally, the tunnel cannot forward requests to it.
The public address became unavailable
A Localtonet tunnel is available only while the selected client device is connected and the tunnel is running. Verify the device, client process, local dashboard, network connectivity, and tunnel status. Device sleep, restart, network loss, a stopped client, or a stopped local service can interrupt access.
Remote users can see more information than intended
Stop the tunnel while investigating. Review application authentication, role permissions, raw-event access, exports, administrative routes, and any identity-proxy configuration. Re-enable remote access only after a least-privileged test account receives the intended restrictions.
Frequently asked questions
Is this a complete installation guide for one gateway and observability stack?
No. It is a stack-neutral architecture and evaluation guide. It defines required hooks, data relationships, standards alignment, verification tests, acceptance criteria, operational controls, and dashboard behavior. Installation commands, ports, configuration files, exporters, and queries must come from the maintained documentation for the specific stack you choose.
Does Localtonet detect AI model overuse?
No. The application, gateway, evaluators, and telemetry pipeline must generate actor, task, conversation, model, usage, cost, and outcome data. With Localtonet, we provide remote connectivity to an approved local dashboard or web service. Tunnel connectivity and semantic AI observability are separate responsibilities.
Can token counts identify an unnecessarily capable model?
No. Token counts show consumption, not required capability or output quality. Use task category, requested and selected models, complete task trajectories, retries, latency, outcomes, and representative evaluations to identify and validate a routing candidate.
Should high-cardinality user and conversation IDs be metric labels?
Usually not. Keep unbounded identifiers on traces or controlled event records and use bounded dimensions for aggregate metrics. Exact limits and storage behavior depend on the selected backend, so verify its cardinality guidance.
Must the system store prompts and responses?
Not necessarily. Many questions can be answered using pseudonymous actors, task categories, model decisions, token usage, turns, retries, latency, and outcomes. Collect content only when necessary and apply redaction, authorization, auditing, retention, and organizational review.
How should retries and agent calls be counted?
Preserve every downstream attempt for operational analysis, but associate related attempts and agent calls with a common logical request, conversation, agent run, and task. This supports provider debugging and complete task-cost analysis without treating every internal call as a new user action.
Does a Localtonet HTTP tunnel secure the dashboard automatically?
The tunnel provides a public HTTPS address and avoids inbound router port forwarding, but the dashboard still needs application authentication, least-privilege authorization, safe data handling, and restricted administrative routes. A public URL is not sufficient authorization.
Should every simple task use the least expensive model?
No. Model selection should account for accuracy, reliability, structured output, context requirements, latency, safety, tool behavior, and complete task outcomes. The goal is an appropriate model for the workload, not the lowest price regardless of quality.
Access your verified AI observability dashboard with Localtonet
Instrument and test the analytics workflow locally first. Then use a Localtonet HTTP tunnel to make the approved, authenticated dashboard reachable through a public HTTPS address without inbound router port forwarding.
Get Started Free →