

Verify a Proxmox monitoring dashboard locally, secure its application login, and then provide controlled remote connectivity
ProxMenux combines a menu-driven Proxmox VE toolkit with ProxMenux Monitor, a web dashboard for host resources, network traffic, virtual machines, and LXC containers. This guide installs the stable project build, separates documented installer behavior from details the project does not currently publish, verifies the systemd service and local endpoint, and explains the security checks required before remote access. It then connects the working dashboard to a Localtonet HTTP tunnel without inbound router port forwarding or a public IP address. The project baseline reviewed for this revision is ProxMenux v1.2.6, identified as the latest release in the supplied project evidence; because the official command executes a mutable script from the main branch, recheck the installer immediately before using it.
📋 What's in this guide
How ProxMenux Monitor and Localtonet fit together
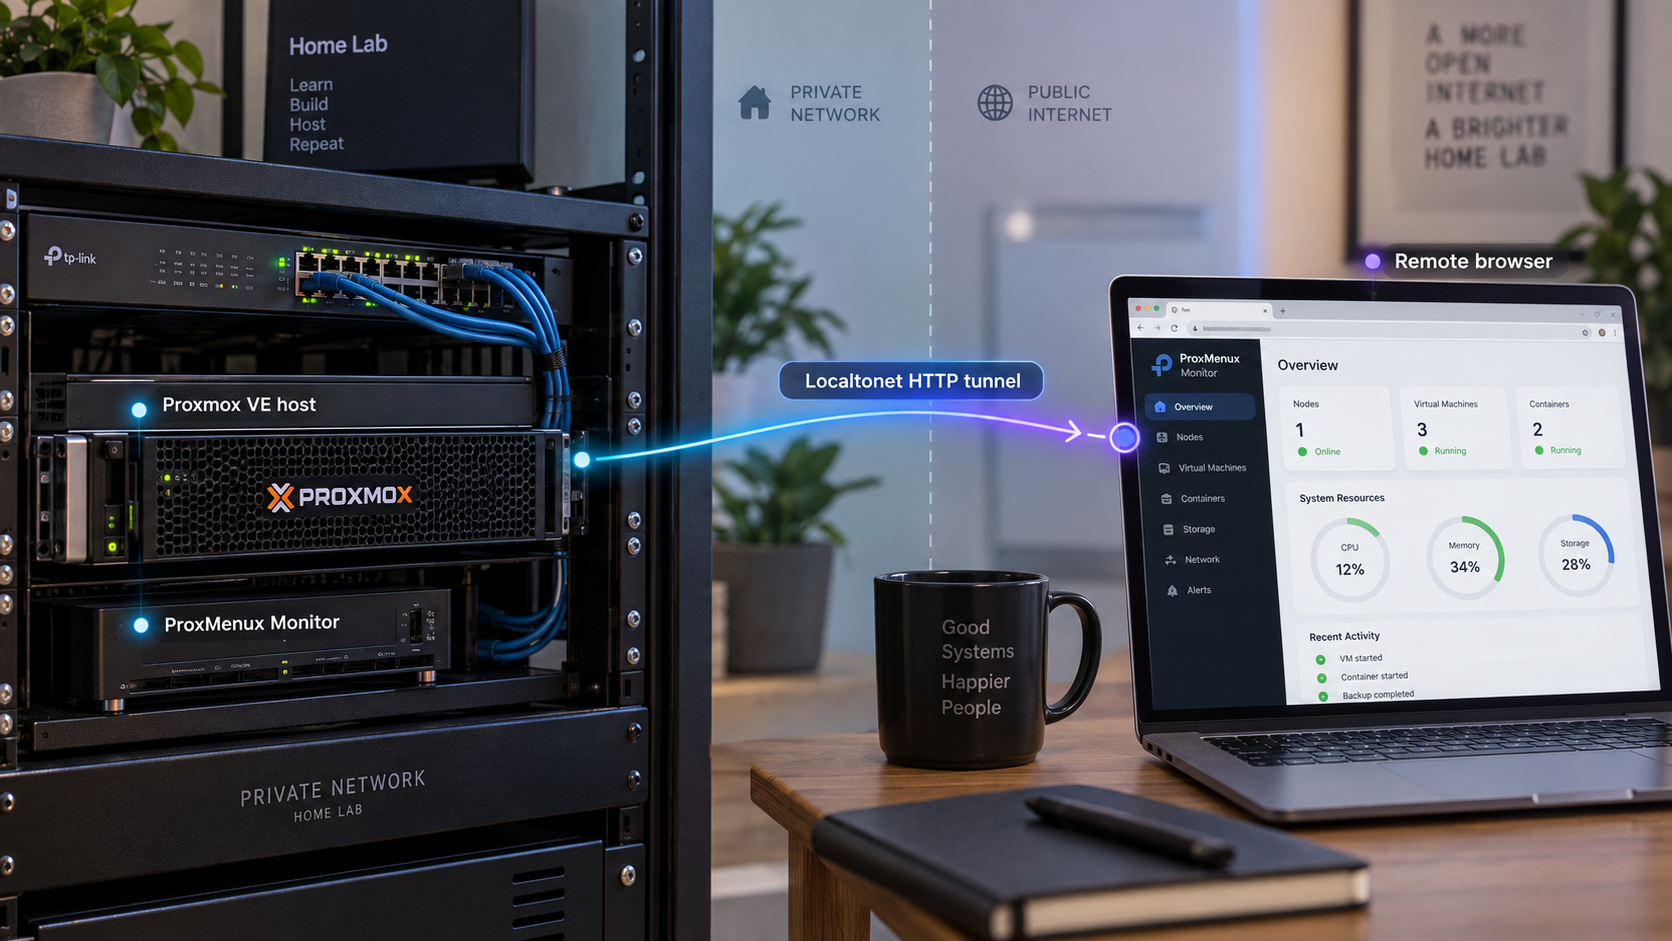
ProxMenux is an interactive toolkit for Proxmox VE. It provides a menu-driven command-line interface for post-installation, backup, restore, and other homelab management workflows. Its standard installation also includes ProxMenux Monitor, a browser-based dashboard that the project describes as providing real-time CPU, RAM, disk, and network information plus status information for virtual machines and LXC containers.
The Monitor and the terminal toolkit are related, but they are not the same interface. Running menu opens the terminal toolkit. The web Monitor runs separately as the systemd unit proxmenux-monitor.service. The project states that this service starts automatically at boot and makes the dashboard available at http://<your-proxmox-ip>:8008.
Localtonet adds a public route only after the application works locally. Our client establishes an outbound connection from a device on your network to a selected Localtonet relay server. An HTTP tunnel can then direct requests received at its public HTTPS address to the reachable ProxMenux HTTP endpoint. This workflow does not require inbound router port forwarding, firewall changes, VPN setup, or a public IP address.
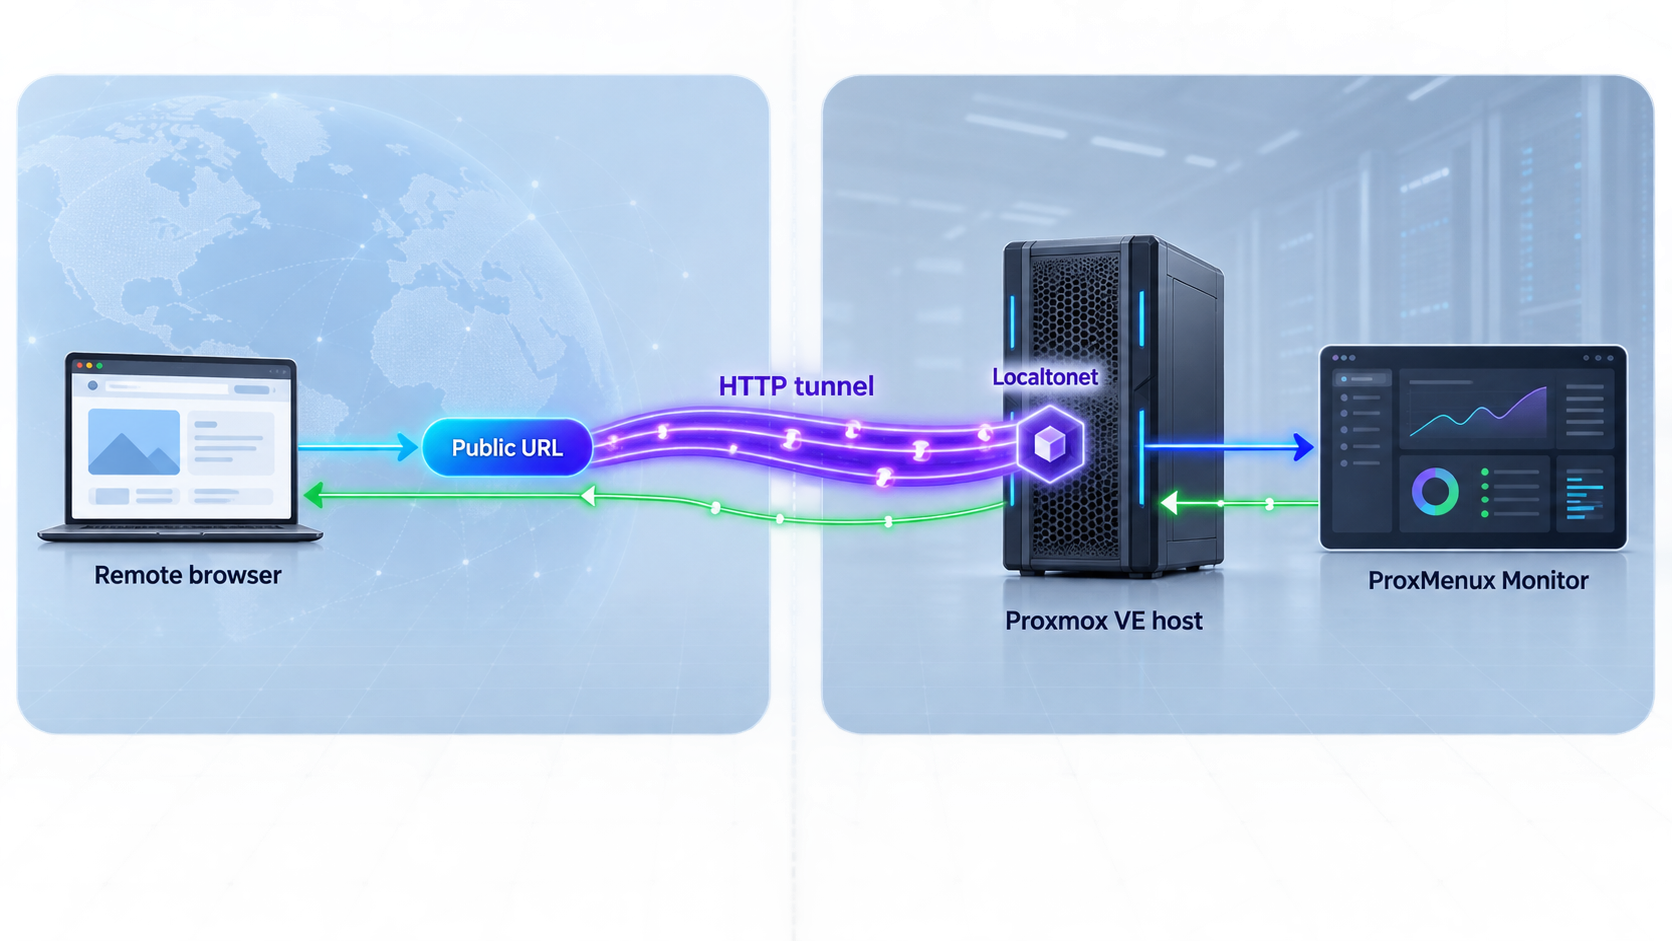
proxmenux-monitor.service and configures it to start at boot.
http://<your-proxmox-ip>:8008.
A Localtonet tunnel transports requests to the configured target. It does not decide who is authorized to use ProxMenux. The Monitor login and any enabled TOTP challenge are the application authorization controls in this workflow. Do not publish the dashboard unless you have independently confirmed that those controls are active and usable.
Version baseline, project links, and evidence limits
This revision uses the project repository and the release identified as ProxMenux v1.2.6 as its evidence baseline. The repository showed additional commits on the main branch after that release. The documented installation command downloads install_proxmenux.sh from that mutable branch, so running the same command at different times may execute different code.
Review the current ProxMenux README and the current installer source immediately before installation. Security-sensitive concerns should be handled according to the project's security policy. Reproducible non-sensitive defects can be reported through the ProxMenux issue tracker.
The supplied README confirms the packages installed, dashboard URL, systemd unit, automatic boot behavior, login support, TOTP support, and basic service commands. It does not document the initial username or password process, the exact TOTP enrollment screens, credential storage, configuration and database paths, recovery codes, lockout recovery, the systemd unit contents, the Monitor process user, or the exact network bind address. The installer body was linked for review but was not included in the supplied extracted evidence, so this article does not invent those details.
This limitation matters. Saying that software supports authentication is not the same as documenting how the first account is created or proving that authentication is enabled in a particular installation. Until the project publishes those steps or they are confirmed directly against the current installer and interface, treat successful login verification as a publication gate rather than assuming secure defaults.
Prerequisites and compatibility checks
The project instructs users to run its installer from the Proxmox server terminal. Because setup installs Debian packages and creates a system service on the virtualization host, use an administrative session with sufficient privileges. The project README does not specify a non-root installation path, an exact Proxmox VE version range, or a complete architecture compatibility matrix for the Monitor.
| Requirement | Documented basis | What to confirm |
|---|---|---|
| Proxmox VE host | ProxMenux is presented as a toolkit for Proxmox VE. | Do not assume that a generic Debian host is an equivalent supported target. |
| Administrative terminal access | The installer adds packages and a systemd service. | Use a maintenance window and an account authorized to modify the host. |
| Outbound repository access | The official command downloads the installer from GitHub. | Confirm DNS, HTTPS access, and the expected repository URL. |
| Working Debian package sources | Setup automatically installs several Debian packages. | Resolve repository or package-manager errors before retrying. |
| Proxmox host LAN address | The documented Monitor URL uses the host address and port 8008. |
Identify an address reachable from the browser and tunnel client. |
| Local browser access | Local testing isolates application faults from tunnel faults. | Verify that the browser has a valid route to the Proxmox host. |
| Recovery preparation | The installer modifies an important virtualization host. | Use your normal Proxmox host recovery and backup procedures before making changes. |
Dependencies documented by ProxMenux
The README states that setup automatically installs dialog for terminal menus, curl for downloads and connectivity checks, jq for JSON processing, git for repository cloning and updates, and python3 plus python3-pip for the Flask-based Monitor. The standard workflow therefore does not require you to install these packages individually beforehand.
Interface translations ship as pre-built JSON files. The documented languages are English, Spanish, French, German, Italian, and Portuguese, with no runtime translation dependency. This does not establish that every newer interface string is translated identically in every build.
The official command pipes a downloaded file directly into Bash. Confirm the repository owner, branch, and script contents before execution. If you require reproducibility, archive the reviewed script and record its commit or checksum under your own change-management process. Do not describe a mutable main-branch script as identical to v1.2.6 unless you have compared it with that release.
Install ProxMenux on the Proxmox VE host
The following sequence preserves the stable installation workflow in the project README. The development branch also has a beta installer, but the project warns that beta builds may contain bugs or incomplete features. This guide uses only the stable main-branch command.
Open an authorized Proxmox server terminal
Start a terminal session directly on the intended Proxmox VE server. Confirm that you are operating on the correct host and that your maintenance and recovery preparations are complete.
Review the current stable installer
Open the linked installer source and compare it with your expected project version. Pay particular attention to package installation, downloaded files, destination paths, systemd unit creation, service account behavior, configuration generation, listener settings, and any update or removal actions. These implementation details must be read from the current script because they are not enumerated by the supplied README.
Run the official stable installation command
If the reviewed script is acceptable for your host, run the project command and follow the prompts it presents.
bash -c " $( wget -qLO - https://raw.githubusercontent.com/MacRimi/ProxMenux/main/install_proxmenux.sh ) "Launch the terminal toolkit when needed
After setup completes, use the documented command below to open the ProxMenux menu. The Monitor is installed automatically by the standard installation, so it does not require a separate installation command in the published workflow.
menuOpening the terminal menu does not prove that the browser dashboard is healthy. The menu and Monitor should be tested separately. Likewise, a working Monitor does not verify every backup, restore, notification, gateway, or other optional ProxMenux feature.
What the installation changes on the host
The project evidence supports a limited but useful description of host changes. It confirms automatic dependency installation, creation of the Monitor systemd service, automatic startup at boot, and an HTTP endpoint using port 8008. It does not provide enough extracted installer content to name every installed file or data directory safely.
| Host change | What is established | What remains unverified |
|---|---|---|
| Debian packages | dialog, curl, jq, git, python3, and python3-pip are installed automatically. |
The exact package transaction for a particular installer revision must be checked in that revision. |
| Terminal launcher | The installed toolkit is launched with menu. |
The supplied README does not state the installed path or every file used by the launcher. |
| Systemd service | The Monitor runs as proxmenux-monitor.service and starts automatically at boot. |
The unit file path, process user, environment, working directory, and hardening directives are not stated in the supplied evidence. |
| Web listener | The documented browser URL uses HTTP and TCP port 8008. |
The exact bind address, socket configuration, and whether the listener can be limited to a selected interface are not documented in the supplied README. |
| Application data | The release notes show that current ProxMenux functionality can persist application state, including SQLite-backed behavior for some features. | The Monitor database, credential, TOTP, secret, configuration, and backup locations are not identified by the supplied evidence. |
| Translations | Pre-built JSON translations are distributed for six documented languages. | The precise destination paths are not given in the supplied README. |
File paths copied from an older release can create unsafe backup, rollback, or credential-reset instructions. Confirm paths against the exact installer and systemd unit installed on your host. This article intentionally does not supply speculative locations.
The published URL indicates that the dashboard is intended to be reachable from a browser on the network, but it does not prove which interface the process binds to in every version. Confirm listener behavior on your installation before adjusting firewall policy or adding remote access.
Verify the service and local dashboard
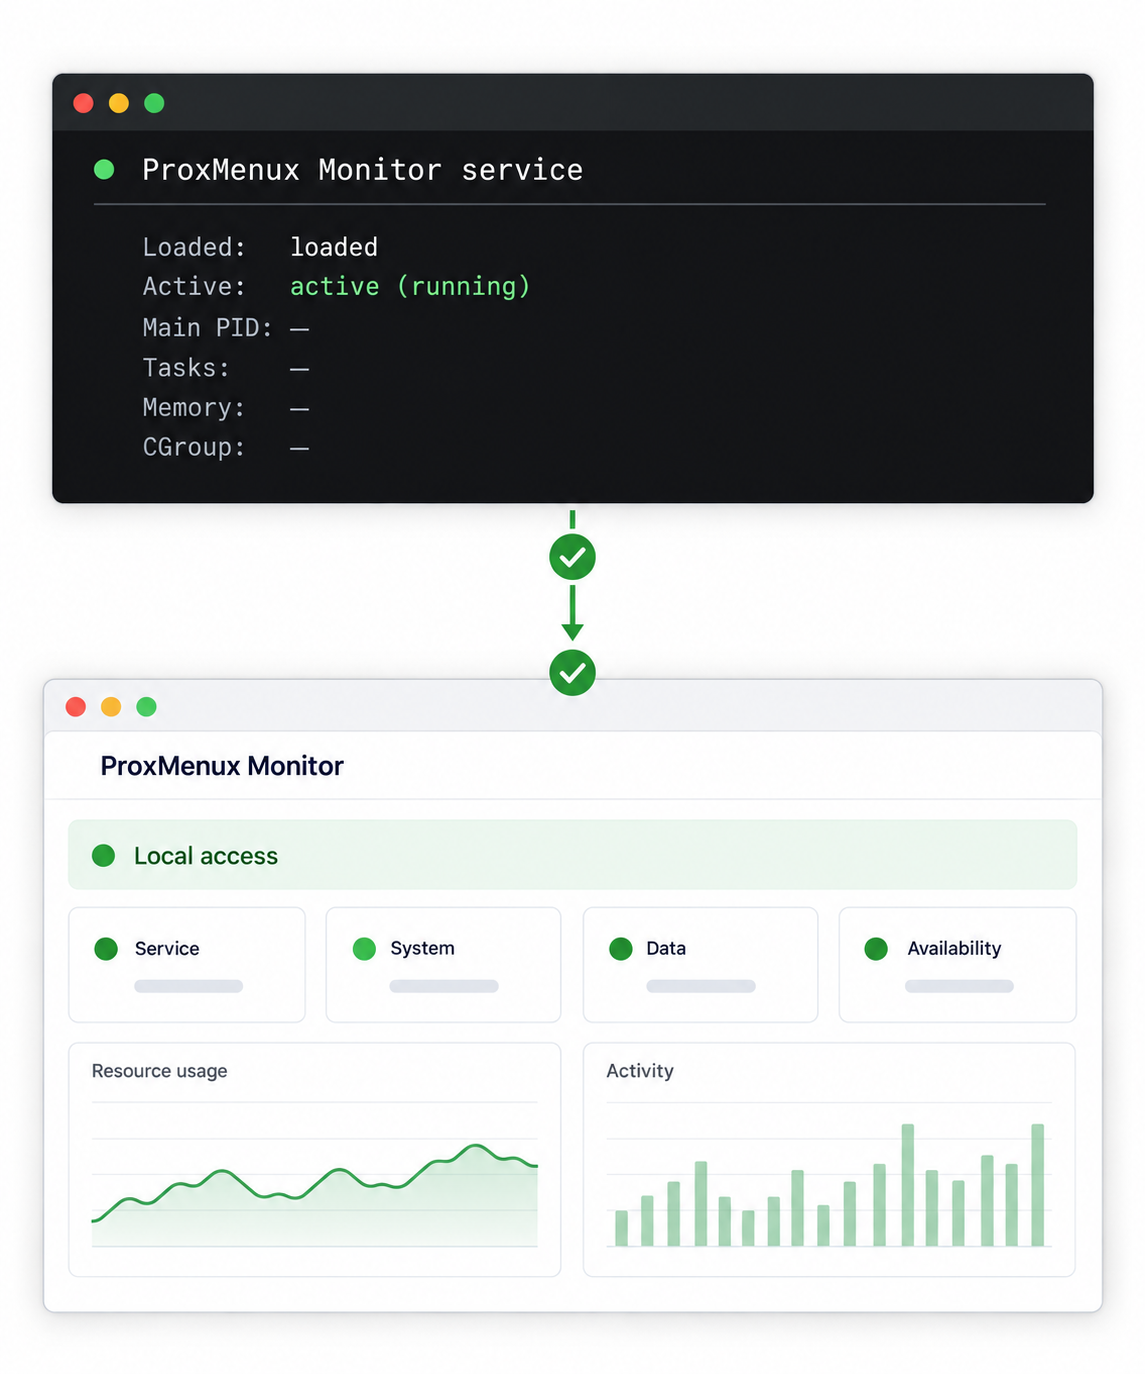
Test from the lowest layer upward. First inspect the service. Next open the dashboard locally. Then verify application behavior and authentication. Finally, repeat the local HTTP test from the device that will run the Localtonet client.
Check the Monitor service
Run the project-documented status command on the Proxmox host. Confirm that the unit is loaded and active, and review any visible startup errors.
systemctl status proxmenux-monitorOpen the documented local endpoint
From a browser on the local network, replace the placeholder with the reachable address of the Proxmox host and open http://<your-proxmox-ip>:8008. The expected result is the ProxMenux Monitor interface rather than a timeout or unrelated service.
Confirm that dashboard data populates
Check that host resource values appear and that the VM and LXC overview reflects your environment. A visible page shell alone does not prove that the backend is collecting or returning data correctly.
Verify authentication explicitly
Sign out or use a private browser session and request the dashboard again. Confirm that unauthenticated access is denied or redirected to the expected login flow. Do not infer that login protection is active merely because the project advertises the feature.
Test from the future tunnel client device
Open the same LAN URL from the device that will run our client. A successful result confirms that this device has a route to the Proxmox host on port 8008.
ProxMenux documents a local HTTP target on port 8008. A Localtonet HTTP tunnel can provide a public HTTPS address for that content. Configure the local target according to the service that actually responds on your network rather than assuming that the Monitor itself uses local HTTPS.
Verify login security and TOTP before remote access
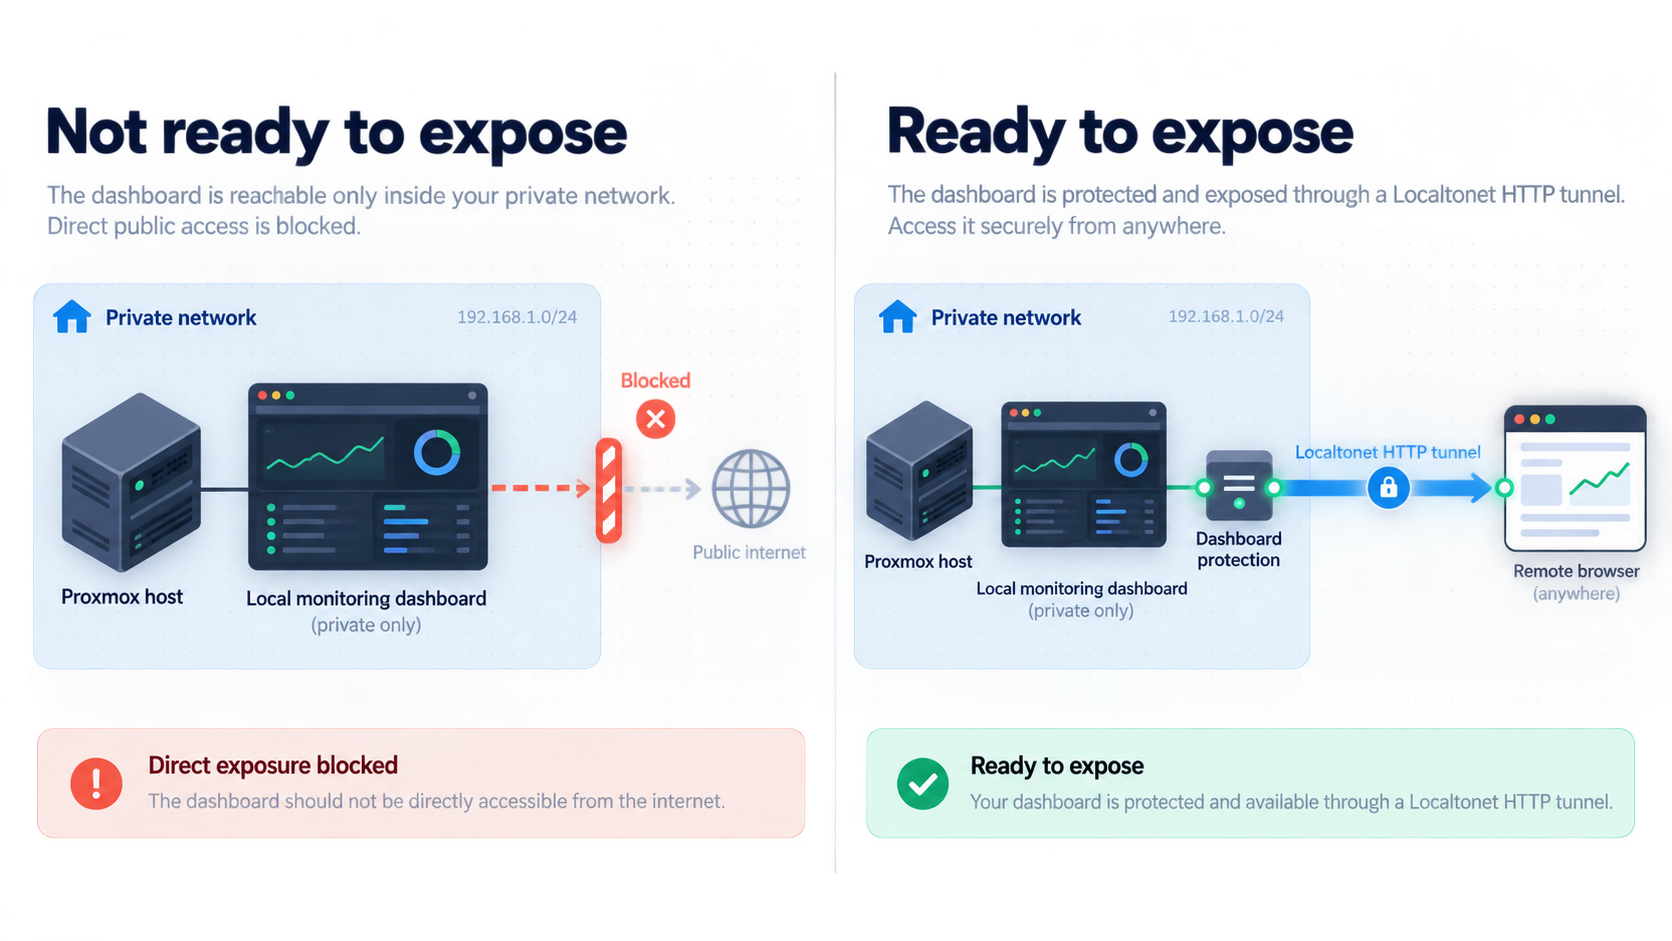
ProxMenux states that the Monitor includes login authentication and TOTP-based two-factor authentication. However, the supplied primary documentation does not explain how the initial account is created, whether a default credential exists, where credentials are stored, how TOTP enrollment is initiated, whether recovery codes are generated, or how an administrator recovers from a lost authenticator.
This article cannot safely provide reproducible enrollment or recovery steps without inventing interface controls or credential locations. Inspect the current Monitor interface and project documentation locally. If you cannot determine how the first account was established, cannot prove that unauthenticated requests are blocked, or cannot identify a supported TOTP recovery method, do not expose the dashboard.
Authentication acceptance test
Before starting a tunnel, perform a practical local test. Use a new private browser session with no existing cookies. Request the Monitor URL and confirm that protected dashboard information is not displayed before login. Sign in with a strong, unique credential. Sign out and verify that the protected view is no longer accessible by using the browser Back button and directly revisiting the dashboard URL.
If the installed interface offers TOTP enrollment, follow the labels shown by that exact version. Store the enrollment secret or any recovery material only in an approved credential manager. Complete enrollment by submitting a current one-time code, sign out, and verify that a fresh login requires both factors. Test recovery only through a procedure documented by the project or confirmed by the current application. Do not edit unknown database or configuration files based on an unofficial path.
If the login screen does not appear, TOTP cannot be completed, or the account-recovery behavior is unclear, stop at local access. Check the project security policy before disclosing a potential authentication weakness. Use the public issue tracker only when the report is suitable for public disclosure and contains no credentials, TOTP secrets, tokens, private addresses, or sensitive infrastructure data.
Reverse proxies are optional in this workflow
ProxMenux documents compatibility with Nginx and Traefik. A reverse proxy is not required for the direct workflow here, where Localtonet targets the reachable Monitor endpoint. If your environment already uses a reverse proxy, decide whether the tunnel should target that proxy or the Monitor itself. That choice depends on your hostname routing, certificates, authentication layers, and local policies.
Create a Localtonet HTTP tunnel for the verified Monitor
Start this stage only after the Monitor works from the intended client device and you have confirmed the login behavior. Our client can run on the service host or another device that can reach it. The critical requirement is that the selected client device can open the ProxMenux address on port 8008.
Register or sign in through the Localtonet account page. Client installation differs by operating system and can change between versions. The supplied evidence does not provide a verified public URL for a standalone download page or current OS-specific commands, so this article does not invent one. Use the client installation option presented by the current Localtonet dashboard for the device's operating system, then run the installed client and associate that device with its device-specific token.
A Localtonet authentication token identifies the client device. Do not place it in command examples, screenshots, shell history shared with others, issue reports, or public configuration files. Redact the complete value before capturing the dashboard or client interface.
The HTTP tunnel configuration uses the device token selection, a currently available relay server, a process type, and the local target. HTTP process types are Random Sub Domain, Custom Sub Domain, and Custom Domain. All three serve the configured content at a public HTTPS address, but availability and domain requirements can vary by plan, client version, region, or deployment.
Install and run the current Localtonet client
From your Localtonet account, obtain the client offered for the operating system of the device that passed the local Monitor test. Install it using the current on-screen instructions and keep the client running. No unverified client command is included here.
Connect and select the intended device
Associate the client with its device-specific authentication token, then select that AuthToken or device in the tunnel configuration. Never reuse a token copied from another tutorial or expose its value.
Open the HTTP tunnel configuration
Create an HTTP tunnel rather than a raw TCP, UDP, File Server, proxy, or VPN configuration. This target is a browser-based HTTP service.
Choose the process type
Select Random Sub Domain, Custom Sub Domain, or Custom Domain according to the options available in your account. For the simplest test, use an available generated-address option. Do not guess custom-domain DNS records; follow the current dashboard requirements if you choose that mode.
Select the relay server
Choose a server or region from the values currently displayed in the dashboard. Do not copy a hardcoded server code from an older tutorial because available values can change.
Enter the local IP address and port
Set the local IP address to the Proxmox host address that worked from this client device. Set the local port to 8008. The local service is documented as HTTP, so keep the target aligned with http://<your-proxmox-ip>:8008.
Start the tunnel
Use the Start control after the configuration is created. Creating or saving a tunnel does not mean that it is running. The public route is available only while the selected client is connected and the tunnel is started.
Test from a separate network
Open the assigned public HTTPS address from a trusted connection outside the LAN. Confirm that the expected ProxMenux login appears, that unauthenticated dashboard data is not exposed, and that login and TOTP work as they did locally.
The Localtonet HTTP tunnel documentation is the canonical companion for the current interface. The reproducible values for this tutorial are an HTTP tunnel, the selected connected client, a relay offered in your dashboard, the process type you choose, the reachable Proxmox host address, local port 8008, and the Start control.
| Layer | Component | Responsibility |
|---|---|---|
| Application process | proxmenux-monitor.service |
Runs the Monitor and starts at boot according to the project README. |
| Local endpoint | http://<your-proxmox-ip>:8008 |
Serves the Monitor to devices that can reach the Proxmox host. |
| Localtonet client | Selected token-associated device | Creates the outbound connection and reaches the configured local target. |
| Public endpoint | Assigned Localtonet HTTPS address | Relays browser requests to the local HTTP target while the client and tunnel are running. |
| Authorization | ProxMenux login and enabled TOTP | Determines whether a user may access the protected Monitor interface. |
Stop or delete the tunnel when remote access is no longer needed. Stopping it removes the Localtonet public path, but it does not alter separate router rules, firewall rules, or reverse proxies you may have configured independently.
Routine operation, updates, backups, rollback, and removal
ProxMenux publishes three useful Monitor service commands. Use them to check status, inspect the latest 50 journal entries, and restart the service. When diagnosing a fault, collect status and logs before restarting so that you preserve evidence of the original failure.
systemctl status proxmenux-monitor
journalctl -u proxmenux-monitor -n 50
systemctl restart proxmenux-monitor| Maintenance task | Verified guidance | Evidence limitation |
|---|---|---|
| Check health | Use systemctl status proxmenux-monitor and test the local dashboard. |
A successful process state does not by itself verify data collection or authentication. |
| Read logs | Use journalctl -u proxmenux-monitor -n 50. |
Sanitize output before sharing it. |
| Restart | Use systemctl restart proxmenux-monitor after capturing diagnostics. |
A restart is not a substitute for finding the underlying cause. |
| Update stable builds | The evidence notes that git supports repository cloning and updates and that beta installations may later offer to switch to stable. |
No complete stable update procedure is documented in the supplied README. |
| Back up application state | Use your normal Proxmox host recovery plan before changes. | The authoritative Monitor data, configuration, credential, and TOTP paths are not identified in the supplied evidence. |
| Rollback | Record the installed version and reviewed installer revision before changing it. | No project-supported Monitor rollback sequence is established by the supplied evidence. |
| Uninstall | Review the current installer and repository for an official removal path. | No verified uninstall command or complete removal manifest is published in the supplied README. |
Removing a service file alone may leave application files, state, dependencies, credentials, or scheduled behavior behind. Conversely, deleting a guessed directory could remove unrelated host data. Until the project documents removal and state locations, use a procedure verified against the exact installer revision or request guidance from the project.
For updates, review the current changelog, release notes, README, and installer before running anything on an existing host. Record your current version and validate the authentication flow after an update. The v1.2.6 release includes changes beyond the Monitor's basic dashboard, so do not assume that every release is limited to cosmetic web changes.
Keep the Localtonet tunnel stopped during maintenance if you do not want the public route available. After updating, repeat service, local endpoint, unauthenticated-session, login, TOTP, and remote tests in that order.
Troubleshoot installation, authentication, and remote connectivity
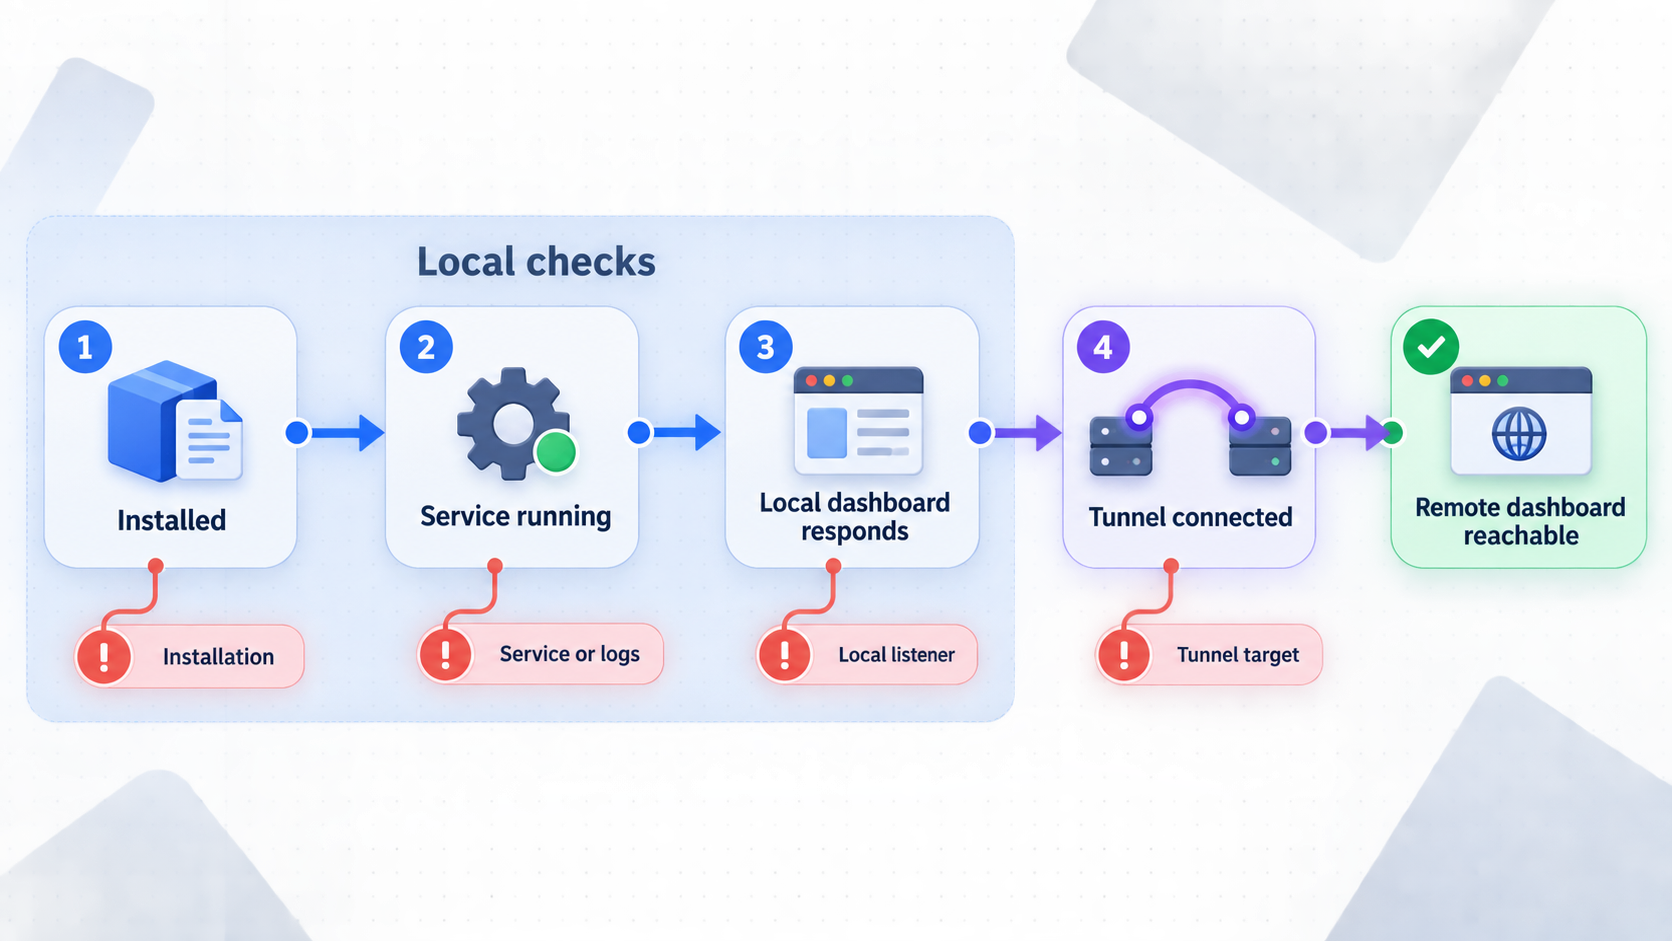
| Symptom | Likely layer | Checks |
|---|---|---|
| The installer cannot be downloaded | Host DNS or outbound connectivity | Confirm name resolution, HTTPS access, and the repository URL from the Proxmox host. |
| Dependency installation fails | Debian package management | Review installer output and correct repository, lock, DNS, or package errors before retrying. |
menu is unavailable |
Incomplete ProxMenux installation | Confirm that setup completed and review its earlier output. Do not assume the Monitor service proves the launcher installed correctly. |
| The Monitor service is failed | systemd or application startup | Run the status and journal commands and identify the first specific error. |
| The service is active but the page does not open | Address, listener, port, or LAN policy | Verify the host address, port 8008, network route, and listener behavior for the installed version. |
| The dashboard opens without a login | Application security | Stop before adding remote access. Verify the current authentication configuration and report unexpected behavior according to the security policy. |
| Login works but TOTP fails | Enrollment, account state, or time synchronization | Test locally, confirm the device and server clocks, and use only the project-supported recovery procedure. |
| The page works on one LAN device but not the tunnel client | Client-device reachability | Correct routing or filtering between that device and the Proxmox host before configuring the tunnel. |
| The tunnel exists but the public URL is unavailable | Localtonet lifecycle | Confirm that the selected device is connected and that the tunnel was explicitly started. |
| The public route loads the wrong service | Local target configuration | Recheck the local IP address, HTTP target, and port 8008. |
| Remote access stopped after a device shutdown | Client availability | Restore the selected client, confirm it is connected, and verify the tunnel's running state. |
Service failure after installation
Start with evidence from the local service:
systemctl status proxmenux-monitor
journalctl -u proxmenux-monitor -n 50
The Localtonet tunnel is not part of the Monitor process and cannot repair a failed systemd service. Resolve package, file, permission, configuration, or application errors locally before returning to tunnel configuration.
Dashboard works on the host but not elsewhere
Make sure the URL uses an address reachable from the other device, not a loopback or host-only address. The README documents the port but not your LAN design or firewall policy. Avoid broadly disabling host security. Determine which interface the installed process uses and make only the narrow network change approved for your environment.
Public address responds but login does not
Test the same credentials and TOTP code against the local endpoint. If local login also fails, the issue belongs to the ProxMenux authentication layer. If local login works but remote login does not, compare browser behavior and review the application journal without disabling authentication. The tunnel transports the HTTP exchange but does not validate ProxMenux credentials.
Disabling authentication, opening broad firewall rules, or forwarding port 8008 directly from a router can create additional exposure. Isolate the failing layer and preserve application authentication throughout testing.
Frequently asked questions
Does the standard ProxMenux installation include the Monitor?
Yes. The project README states that the standard installation automatically installs ProxMenux Monitor as proxmenux-monitor.service and configures it to start at boot.
What local address does ProxMenux Monitor use?
The documented pattern is http://<your-proxmox-ip>:8008. Replace the placeholder with an address that is reachable from the browser and Localtonet client device. The project evidence does not specify the exact bind address used by every release.
What are the initial ProxMenux Monitor credentials?
The supplied primary documentation does not publish an initial username, password, account-creation sequence, or credential storage location. This guide therefore does not guess them. Review the exact installer and local interface, and do not publish the dashboard until you can prove that unauthenticated access is blocked.
How do I enroll or recover ProxMenux TOTP?
ProxMenux documents TOTP support, but the supplied evidence does not document the enrollment screens, secret location, recovery codes, or reset procedure. Use only instructions confirmed by the current project interface or documentation. Do not edit guessed files or database entries to bypass a lost second factor.
Must the Localtonet client run on the Proxmox host?
No. It may run on another device that can reach the ProxMenux HTTP endpoint. Test http://<your-proxmox-ip>:8008 from that exact device before creating the tunnel.
Does Localtonet authorize access to the dashboard?
No. Localtonet provides connectivity to the configured local target. ProxMenux login and any enabled TOTP challenge provide application authorization. Keep those controls active and tested.
Does this workflow require router port forwarding or a public IP address?
No. Our client establishes an outbound connection to a Localtonet relay. The tunnel can provide a public address without inbound router port forwarding, firewall changes, VPN setup, or a public IP address.
How do I update or uninstall ProxMenux Monitor?
The supplied README does not establish a complete stable update, rollback, backup, or uninstall procedure. Review the current repository and installer for your exact revision before modifying an existing host. Do not delete guessed paths or treat reinstalling a mutable main-branch script as a documented rollback.
Why can a saved tunnel still be unavailable?
Creating a tunnel does not start it. The selected Localtonet client must be connected, the tunnel must be running, and the client device must still be able to reach ProxMenux on port 8008.
Connect your verified ProxMenux Monitor with Localtonet
After the service works locally and you have confirmed that ProxMenux login protection behaves correctly, create an HTTP tunnel to the reachable Proxmox host address on port 8008. Keep the device token private, test from a separate network, and stop the tunnel whenever the remote route is not needed.
Get Started Free →