

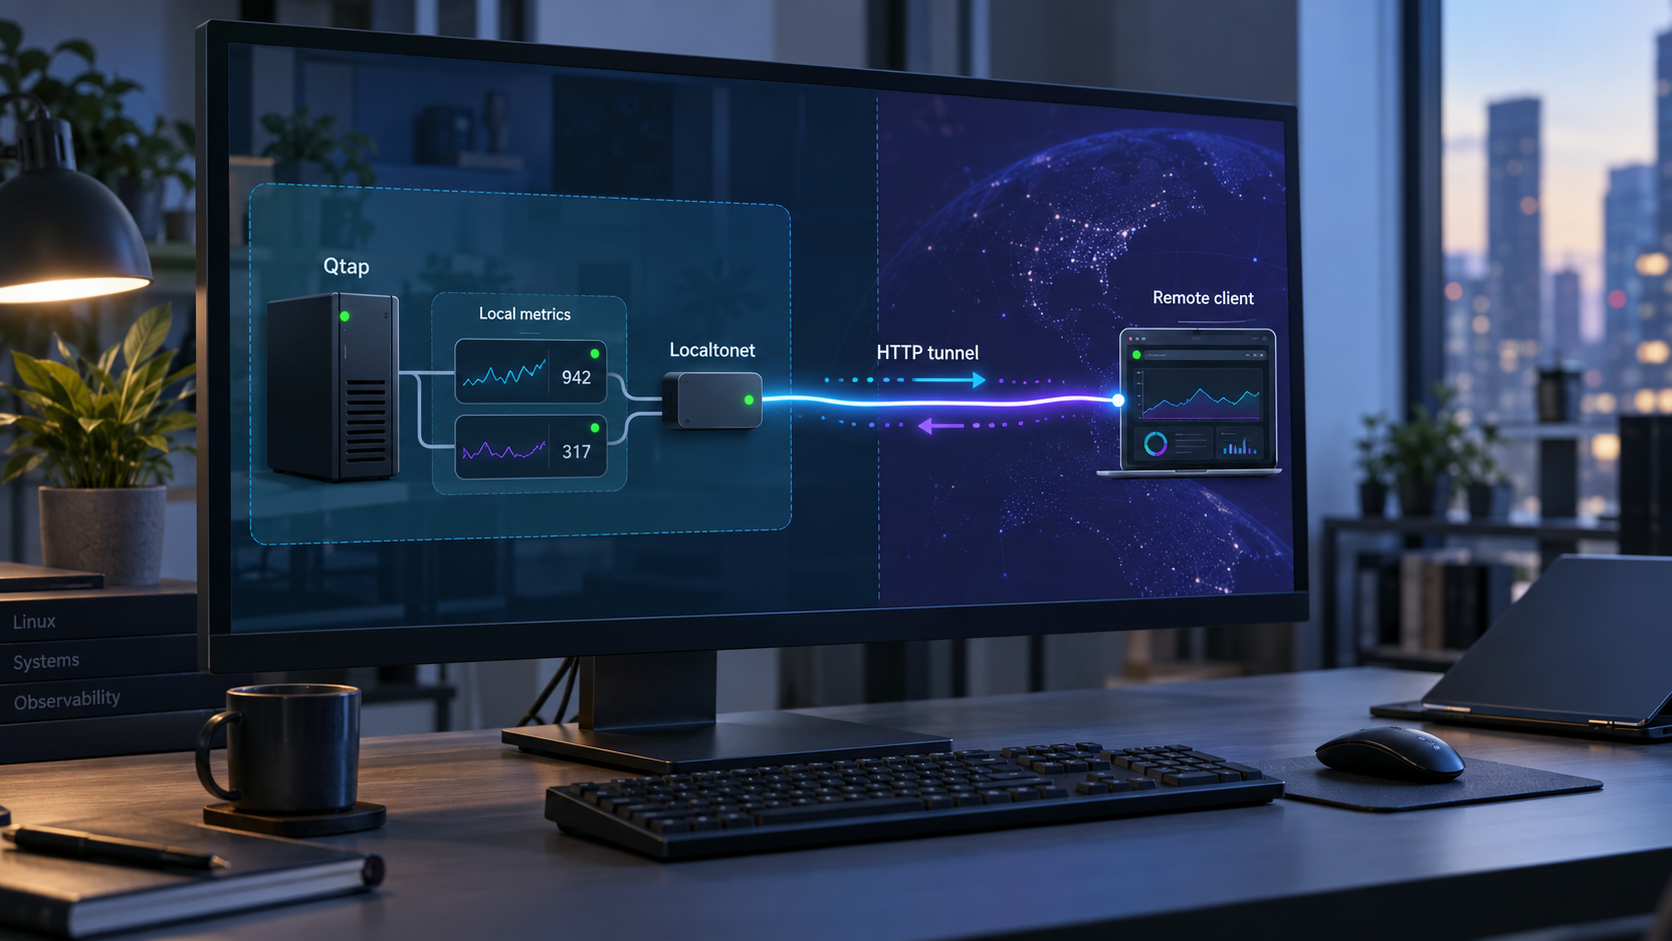
Observe Linux network activity locally, verify Qtap metrics, and make the endpoints reachable when you need remote monitoring
Qtap is a Linux eBPF observability agent that captures traffic flowing through the kernel and associates it with process, container, host, user, and protocol context. This guide covers the documented Linux requirements, host installation, the official Docker deployment, startup, local metrics verification, routine operation, and practical troubleshooting. After Qtap is working locally, we configure a Localtonet HTTP tunnel as a separate step so an authorized remote system can reach the metrics service without inbound router port forwarding or a public IP address. Qtap is currently described by its maintainers as an early-development project, so test upgrades and configuration changes before relying on them in a production monitoring workflow.
📋 What's in this guide
How Qtap and Localtonet fit into this workflow
Qtap observes network activity on a Linux host using eBPF. It attaches to TLS and SSL functions so that supported traffic can be inspected before encryption and after decryption, then passes the resulting data and context to plugins. This can help with security auditing, API debugging, troubleshooting third-party integrations, validating application changes, and investigating systems whose network behavior is not well documented.
Qtap is not installed merely to create a public dashboard. Its primary job is local observability. The remote-access portion of this guide therefore begins only after the agent is running and its documented HTTP metrics endpoints respond locally. Keeping those stages separate makes troubleshooting much easier: first prove that Qtap works, then prove that the tunnel can reach the already working service.
/metrics and Qtap agent health metrics at /system/metrics on localhost port 10001.
The Localtonet client should normally run on the same Linux host as Qtap in this workflow. That placement allows it to connect to Qtap through the documented loopback endpoint without changing Qtap's listening behavior or exposing port 10001 directly on the LAN. A client on another machine cannot use its own localhost address to reach Qtap because localhost always refers to the machine making the connection.
This guide tunnels only Qtap's evidenced HTTP metrics service on port 10001. Qtap also mentions a built-in DevTools interface, but the supplied official project information does not establish its listening address or port. We therefore do not guess a DevTools tunnel target. Consult the current Qtap DevTools documentation before attempting to expose that interface.
Check the Linux prerequisites before installing Qtap
Confirm the operating-system and kernel requirements before running an installer. A failed prerequisite can look like an application problem even though the agent never had the kernel facilities or permissions needed to attach its eBPF programs.
| Requirement | Documented expectation | How to assess it |
|---|---|---|
| Operating system | A Linux host | Run uname -s and confirm that the result is Linux. |
| Kernel version | Linux kernel 5.10 or newer | Run uname -r and compare the reported kernel version with the requirement. |
| BPF Type Format | BTF must be enabled | Verify that /sys/kernel/btf/vmlinux exists. |
| eBPF | eBPF must be enabled on the host | Check the host or distribution's kernel configuration if Qtap reports BPF loading or attachment errors. |
| Privileges | Elevated host or container permissions | Run the host binary with sudo, or use the documented Docker privileges and host integration. |
| Remote tunneling | A Localtonet client on a device that can reach the service | For a loopback-only service, place the client on the Qtap host and target 127.0.0.1:10001. |
Inspect the operating system and kernel
uname -s
uname -r
The first command should identify Linux. The second prints the active kernel release. Qtap requires kernel 5.10 or newer. Distribution version labels are not a substitute for checking the active kernel because a distribution can ship different kernel streams or retain an older kernel after an incomplete upgrade.
Verify BPF Type Format support
test -e /sys/kernel/btf/vmlinux && echo "BTF is available" || echo "BTF is not available at the documented path"
Qtap specifically documents the presence of /sys/kernel/btf/vmlinux as the BTF check. If the file is missing, stop before installation and investigate your distribution's kernel packages and configuration. The exact package or kernel replacement needed varies between distributions, so this guide does not invent a universal package-manager command.
Plan for elevated access
A host installation is started with sudo qtap. The official Docker example likewise runs as root, uses privileged mode, adds BPF and system-administration capabilities, joins the host PID and network namespaces, mounts host resources, and removes the memlock limit. These permissions are substantial because Qtap must interact with kernel and process facilities that an ordinary application cannot access.
Qtap can observe sensitive network content in its original form, including data around TLS processing. Install it only on systems where you are authorized to inspect traffic. Restrict administrator access to the host, review the project and deployment method according to your organization's software policy, and avoid exposing observability endpoints more broadly than necessary.
Install and run Qtap directly on the Linux host
Direct host installation is the shortest documented path for testing Qtap on a compatible Linux system. The installer is fetched from get.qpoint.io and piped to a privileged shell. Because that pattern executes remotely retrieved code as root, evaluate it under your normal software review policy before use. In controlled environments, administrators may choose to inspect installation content and project releases before approving deployment.
Confirm the host prerequisites
Verify Linux, kernel 5.10 or newer, the BTF file at /sys/kernel/btf/vmlinux, enabled eBPF support, and permission to use sudo. Resolve prerequisite failures before installing the agent.
Run the documented installer
Execute the official installation command shown below. It downloads the Qtap installation script and runs it with elevated privileges.
Start Qtap with its defaults
Run sudo qtap. Keep the process running while you perform local verification from another terminal session.
curl -s https://get.qpoint.io/install | sudo sh
sudo qtap
Do not add flags merely because another release or an unofficial tutorial uses them. The evidenced quick-start command runs Qtap with its defaults. Watch the terminal for startup messages and errors. If the process exits immediately, investigate its output before moving to Localtonet.
Optional temporary demo mode
Qtap also documents a temporary demo command that displays traffic in real time in the terminal:
curl -s https://get.qpoint.io/demo | sudo sh
Demo mode is useful for an initial evaluation, but it should not be confused with the installed-agent workflow used by the rest of this guide. For metrics verification and repeatable operation, follow the documented install command and start the installed qtap binary.
The supplied project evidence documents installation followed by sudo qtap, but it does not establish a systemd unit name, an automatic-start policy, a configuration file path, or a shutdown command. This guide does not invent those details. Treat the foreground process as the verified startup method and consult the current Qtap release documentation before creating production service management.
Run Qtap using the documented Docker configuration
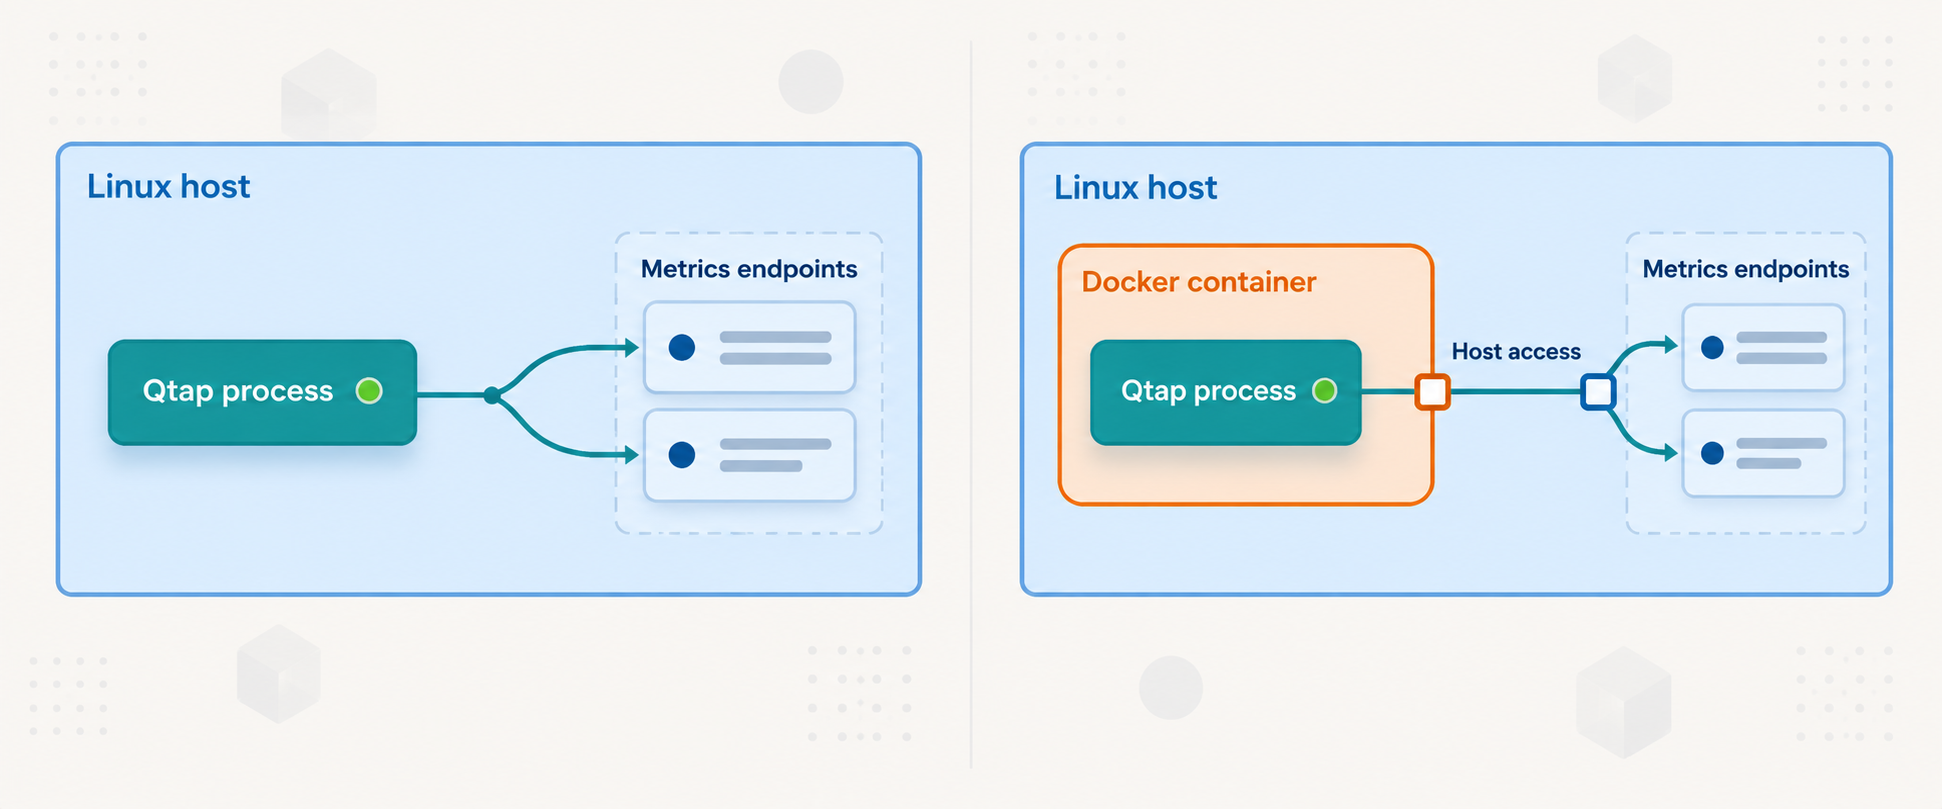
Docker can package the Qtap userspace process, but it does not remove Qtap's need to interact deeply with the Linux host. The official invocation uses privileged mode, host PID and network namespaces, capability additions, host mounts, root execution, and an unlimited memlock setting. This is not an isolated, low-permission container profile.
Validate the Linux host
Confirm kernel 5.10 or newer, BTF at the documented path, enabled eBPF, a working Docker installation, and authorization to run a privileged container with host integration.
Start the official Qtap container image
Run the documented command exactly as shown. It uses the v0 image tag, host networking and PIDs, the required mounts, elevated capabilities, and informational logging.
Keep the container attached while testing
Observe the container output for startup or eBPF errors, then use a second host terminal to request the metrics endpoints. The documented command does not include detached mode or a restart policy.
docker run \
  --user 0:0 \
  --privileged \
  --cap-add CAP_BPF \
  --cap-add CAP_SYS_ADMIN \
  --pid=host \
  --network=host \
  -v /sys:/sys \
  -v /var/run/docker.sock:/var/run/docker.sock \
  -e TINI_SUBREAPER=1 \
  --ulimit=memlock=-1 \
  us-docker.pkg.dev/qpoint-edge/public/qtap:v0 \
  --log-level=info
Host networking is particularly relevant to the metrics workflow. The container shares the host's network namespace, so the documented service on localhost port 10001 can be checked from the host. The Docker socket mount and host PID namespace also give the container significant visibility into the host. Do not treat this command as suitable for an untrusted multi-tenant environment without a separate security review.
The evidence does not establish an alternate restricted container profile. Removing privileges, mounts, capabilities, or namespace sharing may prevent Qtap from discovering processes or loading and attaching eBPF programs. If your security policy prohibits this deployment model, do not weaken the command by trial and error and assume the result remains fully functional. Evaluate a dedicated host, a controlled test system, or updated official deployment guidance instead.
Verify both Qtap metrics endpoints locally
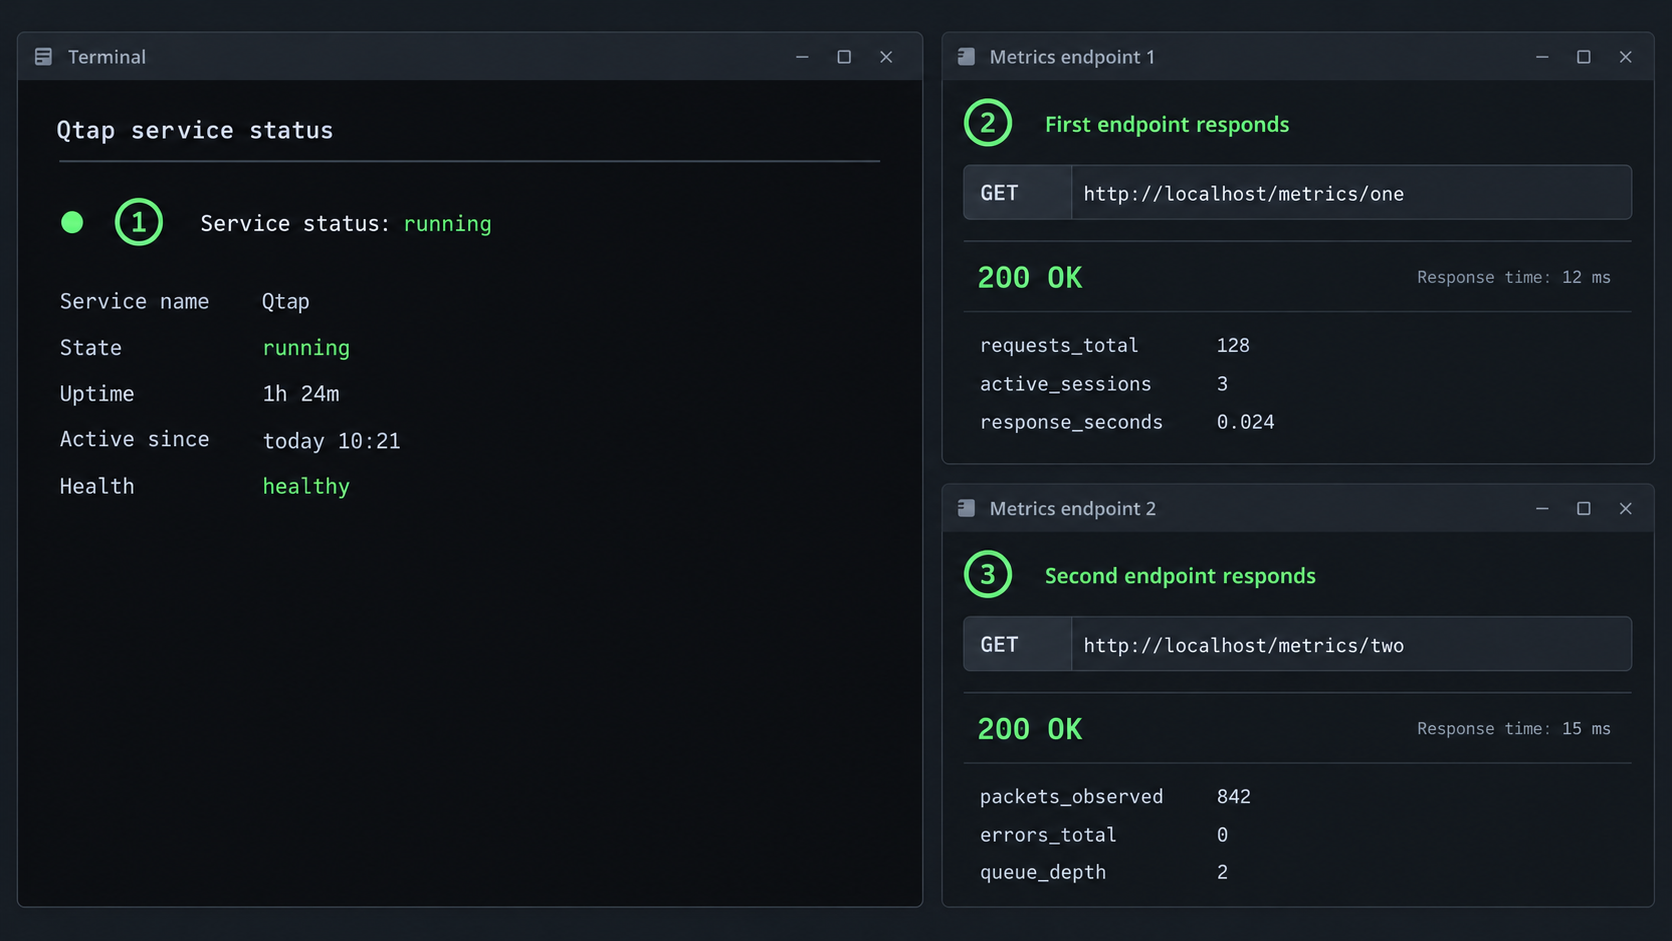
Local verification is the most important checkpoint in the guide. A tunnel cannot repair an agent that failed to start, a missing kernel feature, or a local HTTP endpoint that is not listening. Run the following requests on the same Linux host where Qtap is running.
curl http://localhost:10001/metrics
curl http://localhost:10001/system/metrics
The first endpoint contains metrics intended for dashboards that monitor activity on the system. The second contains metrics related to the health of the Qtap agent. A successful HTTP response from each path confirms that the metrics service is reachable locally. The precise set of metric names can evolve with the project, so build monitoring rules against the version you have validated rather than assuming every release exports an identical schema.
| Path | Purpose | Recommended validation |
|---|---|---|
/metrics |
Metrics for monitoring activity on the system | Confirm that the request succeeds and returns a nonempty metrics payload appropriate to your installed version. |
/system/metrics |
Metrics concerning Qtap agent health | Confirm that the endpoint responds, then inspect the available agent-health series before creating alerts. |
| Qtap process output | Startup and runtime diagnostics | Check the active terminal or container output for BPF, permission, attachment, or runtime errors. |
Generate authorized test traffic if activity is sparse
Qtap's activity metrics reflect what the host is doing. A quiet test host may produce little observable application traffic. Generate a normal, authorized request from an application on that host and then request /metrics again. Do not transmit production secrets merely to make a demonstration more interesting.
Distinguish HTTP reachability from meaningful observation
An HTTP response proves that the metrics server is reachable, but it does not by itself prove that every desired process or protocol is being observed. Review Qtap's process output and the returned metric series. Confirm that the workload you care about is represented under the conditions you plan to monitor.
Qtap's repository includes examples/dashboards/qtap-http-overview.json. This can be useful when building a local observability view. The supplied evidence does not specify a Grafana installation procedure, data-source configuration, or remote-scrape topology, so those environment-specific steps are outside this tutorial.
Expose the verified Qtap metrics service with Localtonet
Once both local requests work, you can create a Localtonet HTTP tunnel to the metrics listener. Our client establishes an outbound connection to a Localtonet relay server, so you do not need inbound router port forwarding, firewall changes, VPN setup, or a public IP address for this workflow.
Install and run the Localtonet client on the Qtap host whenever possible. Because Qtap documents its metrics on localhost:10001, the client must share that host's loopback network context to use 127.0.0.1 as the target. If the client runs in a separate container, VM, or physical machine, its loopback address will not refer to Qtap.
Install and run the Localtonet client on the Qtap host
Use the current Localtonet application for the host operating system. Keep the client running on the Linux device that can reach Qtap at 127.0.0.1:10001. Current installation details should be taken from our application and documentation because client packaging can change.
Authenticate or select the Linux device
Use the device-specific authentication token associated with the client. Do not paste the token into scripts, screenshots, monitoring labels, or this article's example commands.
Select an available relay server
Choose a currently available server or region from the Localtonet dashboard. Availability can vary, so obtain the value from the live product instead of copying a hardcoded server code from a tutorial.
Create an HTTP tunnel to the local service
Select the HTTP tunnel family and configure the local target as IP address 127.0.0.1 and port 10001. Use a currently available HTTP process type that fits your deployment. Random Sub Domain, Custom Sub Domain, and Custom Domain all serve content at a public HTTPS address, but availability and domain requirements must be confirmed in the current dashboard.
Start the tunnel
Creating the tunnel does not start it. Press the Start button and wait until the selected client and tunnel are connected. The tunnel remains available only while the client is connected and the tunnel is running.
Test the assigned public HTTPS address
Use the public URL assigned in the dashboard and request the documented metrics paths. Verify both /metrics and /system/metrics from an authorized remote system before configuring a collector.
For the current interface and HTTP-specific configuration details, consult our
Localtonet HTTP tunnel documentation.
The essential target for this workflow is the locally verified Qtap service at 127.0.0.1:10001.
After the tunnel starts, append the same path used locally to the assigned public HTTPS URL. For example, if the dashboard displays https://your-assigned-address.example, the conceptual paths are https://your-assigned-address.example/metrics and https://your-assigned-address.example/system/metrics. That hostname is deliberately illustrative, not a real Localtonet address. Always use the exact URL displayed for your tunnel.
Do not assume Qtap's local metrics listener supplies authentication merely because it is exposed through HTTPS. The supplied evidence does not document authentication on these endpoints. Before sharing a public URL or connecting a remote scraper, review the current access-control options available to your account and tunnel, apply least privilege, and expose the service only to authorized users or systems. Stop the tunnel when remote access is no longer required.
Secure the observability and tunnel boundary
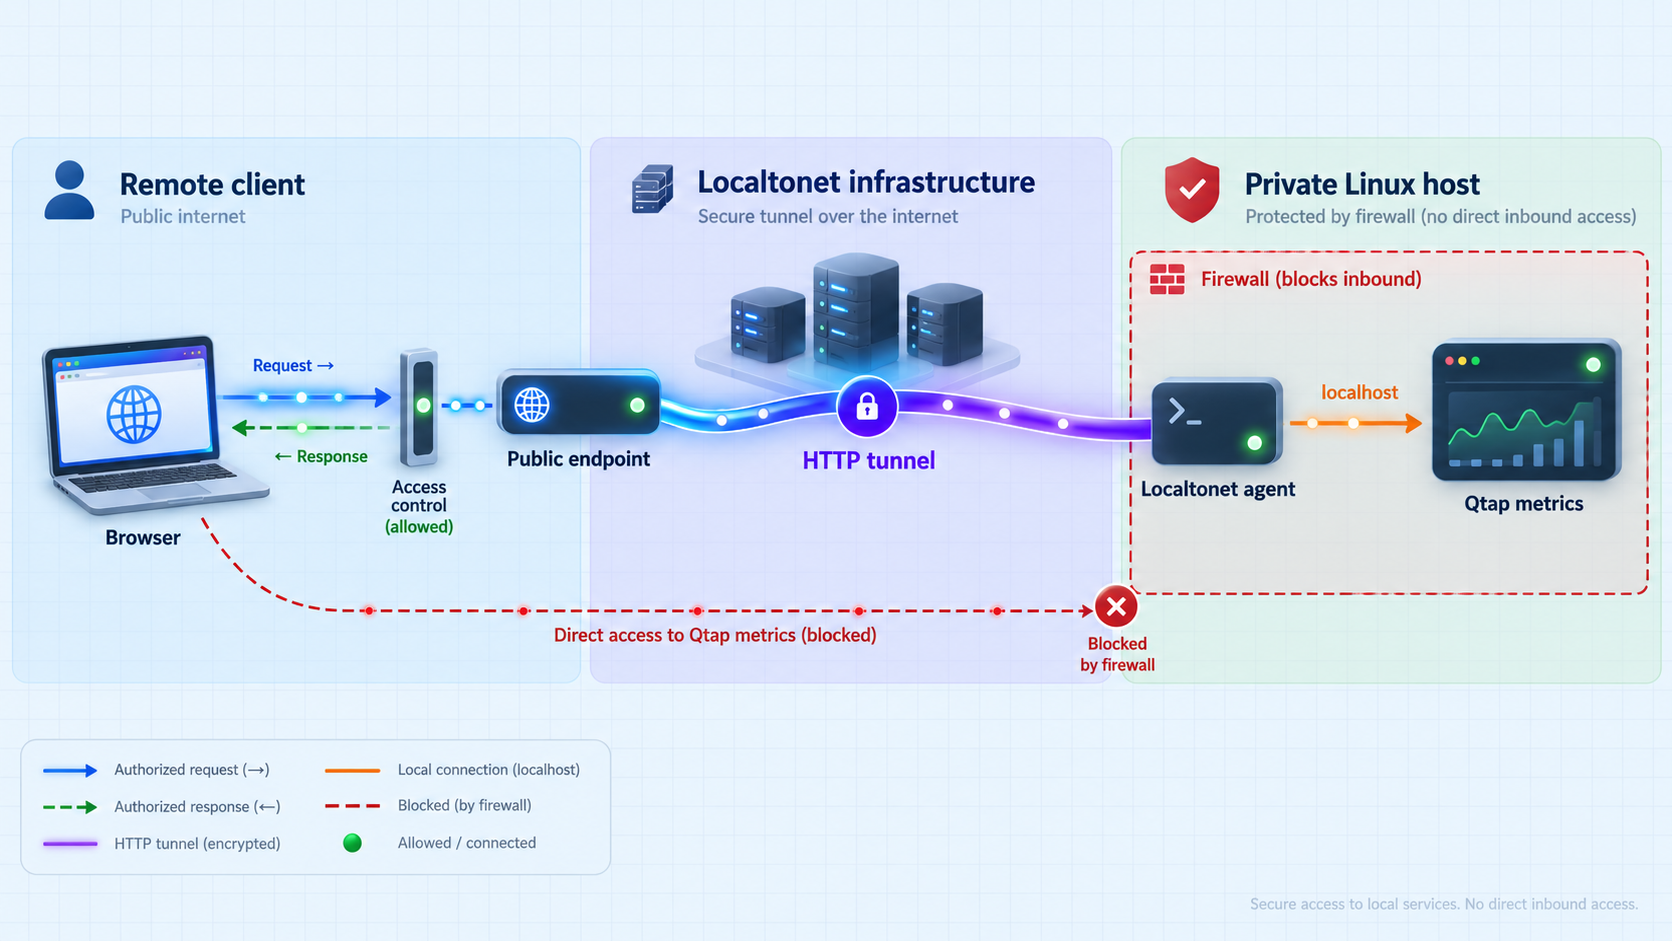
This deployment combines a highly privileged observability agent with a remotely reachable metrics endpoint. Those are separate security boundaries. Qtap's privileges concern what it can observe on the Linux host. The Localtonet tunnel concerns who can reach the HTTP service from outside the local network.
Protect the Qtap host
Restrict administrative access and keep the Linux kernel, Docker engine if used, Qtap, and the Localtonet client under your normal patch and change-management process. The Docker deployment has broad host visibility through privileged mode, host namespaces, /sys, and the Docker socket. Do not allow untrusted users to control that container or replace its image.
Minimize remote exposure
Start the tunnel only for the period in which remote collection or troubleshooting is required. A created tunnel is not active until it is started, and you can stop or delete it later. If you need continuous monitoring, document the business reason, intended consumers, ownership, review interval, and incident response procedure.
Keep tokens and endpoints out of logs
A Localtonet authentication token identifies the client device and must remain private. Do not put it into Qtap labels, shell history examples, public repositories, dashboards, or alert annotations. Public tunnel addresses should also be handled carefully, especially when the upstream service has no evidenced authentication layer.
Separate metrics from captured traffic
The endpoints in this tutorial are metrics endpoints. They are not presented as a remote interface for retrieving all captured payloads. Do not infer undocumented remote data capabilities from Qtap's ability to inspect traffic locally. Validate exactly what your installed version exports before deciding who may access it.
Operate and troubleshoot the complete setup
Use a layered diagnostic sequence
Troubleshoot from the inside out. First confirm that Qtap is running. Next confirm the local HTTP endpoint. Then confirm the Localtonet client. Finally confirm that the tunnel is started and that the remote request uses the correct path. Testing in this order prevents a public connectivity symptom from hiding a local agent failure.
| Symptom | Likely area | What to check |
|---|---|---|
| Qtap exits during startup | Kernel support or permissions | Check kernel version, BTF presence, eBPF availability, elevated privileges, and the exact startup output. |
| Local port 10001 does not respond | Qtap process or metrics listener | Confirm that sudo qtap or the Docker container is still running and inspect its logs. |
/metrics works but appears quiet |
Workload activity or observation coverage | Generate authorized application traffic and inspect Qtap output for attachment or process-discovery issues. |
| Docker startup reports BPF errors | Host capability or altered container options | Recheck BTF, eBPF, kernel compatibility, privileges, capabilities, namespaces, mounts, and memlock configuration. |
| Local metrics work but the public URL does not | Localtonet client or tunnel lifecycle | Confirm the selected device is connected, the target is 127.0.0.1:10001, and the tunnel has been started. |
| The public root URL responds unexpectedly | Incorrect path | Request the documented /metrics or /system/metrics path rather than assuming the root path has a user interface. |
| A client on another machine cannot reach localhost | Network namespace mismatch | Run the Localtonet client on the Qtap host. Another machine's 127.0.0.1 points to itself, not to Qtap. |
Confirm the process is still running
The documented host command runs Qtap in the foreground. If the terminal closes or the process stops, the metrics listener may disappear. The documented Docker command is also attached because it does not include -d. Check the relevant terminal output before investigating networking.
Repeat the local request using the numeric loopback address
curl http://127.0.0.1:10001/metrics
curl http://127.0.0.1:10001/system/metrics
Using 127.0.0.1 mirrors the suggested Localtonet target and removes local hostname resolution from the test. If these requests fail, leave the tunnel out of the investigation until the local service responds.
Recheck Docker command fidelity
If the container starts but cannot observe the host correctly, compare the running command with the official invocation in this guide. Pay particular attention to --privileged, the two added capabilities, host PID and network modes, both mounts, root user, TINI_SUBREAPER, and the memlock ulimit. Container hardening tools or orchestration policies may reject or rewrite some of these options.
Verify tunnel state separately from tunnel existence
A saved tunnel configuration is not proof that the endpoint is online. In our platform, a tunnel must be started. It also depends on the selected Localtonet client remaining connected. If either Qtap or the client is stopped, remote access will fail even though the tunnel still appears in the dashboard.
Plan upgrades conservatively
Qtap is in early development. APIs and exported metrics may change, and documentation may have gaps. Before upgrading a monitored host, test the new version against your kernel, workload, dashboard queries, alerts, and remote scraper. Keep a record of the image tag or installed version used by each environment. The official Docker example currently uses the broad v0 tag, so do not assume its contents remain identical indefinitely.
Stop access when the task is complete
Stop or delete the Localtonet tunnel when remote access is no longer necessary. Then stop Qtap according to the way you launched it. For the documented foreground host or Docker workflow, use your terminal's normal process interruption mechanism. This article does not claim an application-specific shutdown subcommand because none is established by the supplied evidence.
Frequently asked questions
What Linux kernel version does Qtap require?
Qtap documents Linux kernel 5.10 or newer. The host also needs BPF Type Format support, with /sys/kernel/btf/vmlinux present, and eBPF enabled. Check the active kernel with uname -r rather than relying only on the distribution release name.
Which Qtap metrics endpoints are documented?
Qtap documents two HTTP endpoints on localhost port 10001. /metrics contains metrics for monitoring activity on the system, while /system/metrics contains metrics related to Qtap agent health.
Should the Localtonet client run on the same host as Qtap?
Yes, that is the straightforward configuration for the documented loopback endpoint. Run our client on the Qtap host and configure the HTTP target as 127.0.0.1 on port 10001. A client on another machine cannot reach Qtap through its own loopback address.
Does creating a Localtonet tunnel make it active immediately?
No. After creating the tunnel, you must start it with the Start button. It remains available only while the selected client is connected and the tunnel is running. You can stop or delete it when remote access is no longer needed.
Can I tunnel Qtap's DevTools interface using the same port?
This guide does not make that claim. Qtap documents a built-in DevTools interface, but the supplied project information does not establish its listening address or port. Port 10001 is evidenced for the two metrics paths only. Check the current Qtap DevTools documentation before creating a separate tunnel.
Does the metrics endpoint include authentication?
Authentication for Qtap's metrics listener is not established by the supplied evidence, so do not assume it exists. Treat the output as sensitive, review the current access controls available for your Localtonet configuration, limit the audience, and stop the tunnel when it is not needed.
Why does the Qtap Docker container need so many privileges?
Qtap needs access to host kernel and process facilities for eBPF-based observation. Its documented Docker command uses root, privileged mode, BPF and system-administration capabilities, host PID and network namespaces, host mounts, and an unlimited memlock setting. Review this trust model before deployment.
Can Localtonet fix a Qtap endpoint that does not work locally?
No. The tunnel forwards requests to the configured local target. Qtap must already be running and responding at 127.0.0.1:10001. Always verify both metrics paths locally before troubleshooting remote connectivity.
Connect your verified Qtap metrics endpoint with Localtonet
After Qtap responds locally on port 10001, run our client on the same Linux host, create an HTTP tunnel to 127.0.0.1:10001, start it, and test the two documented metrics paths from an authorized remote system.