

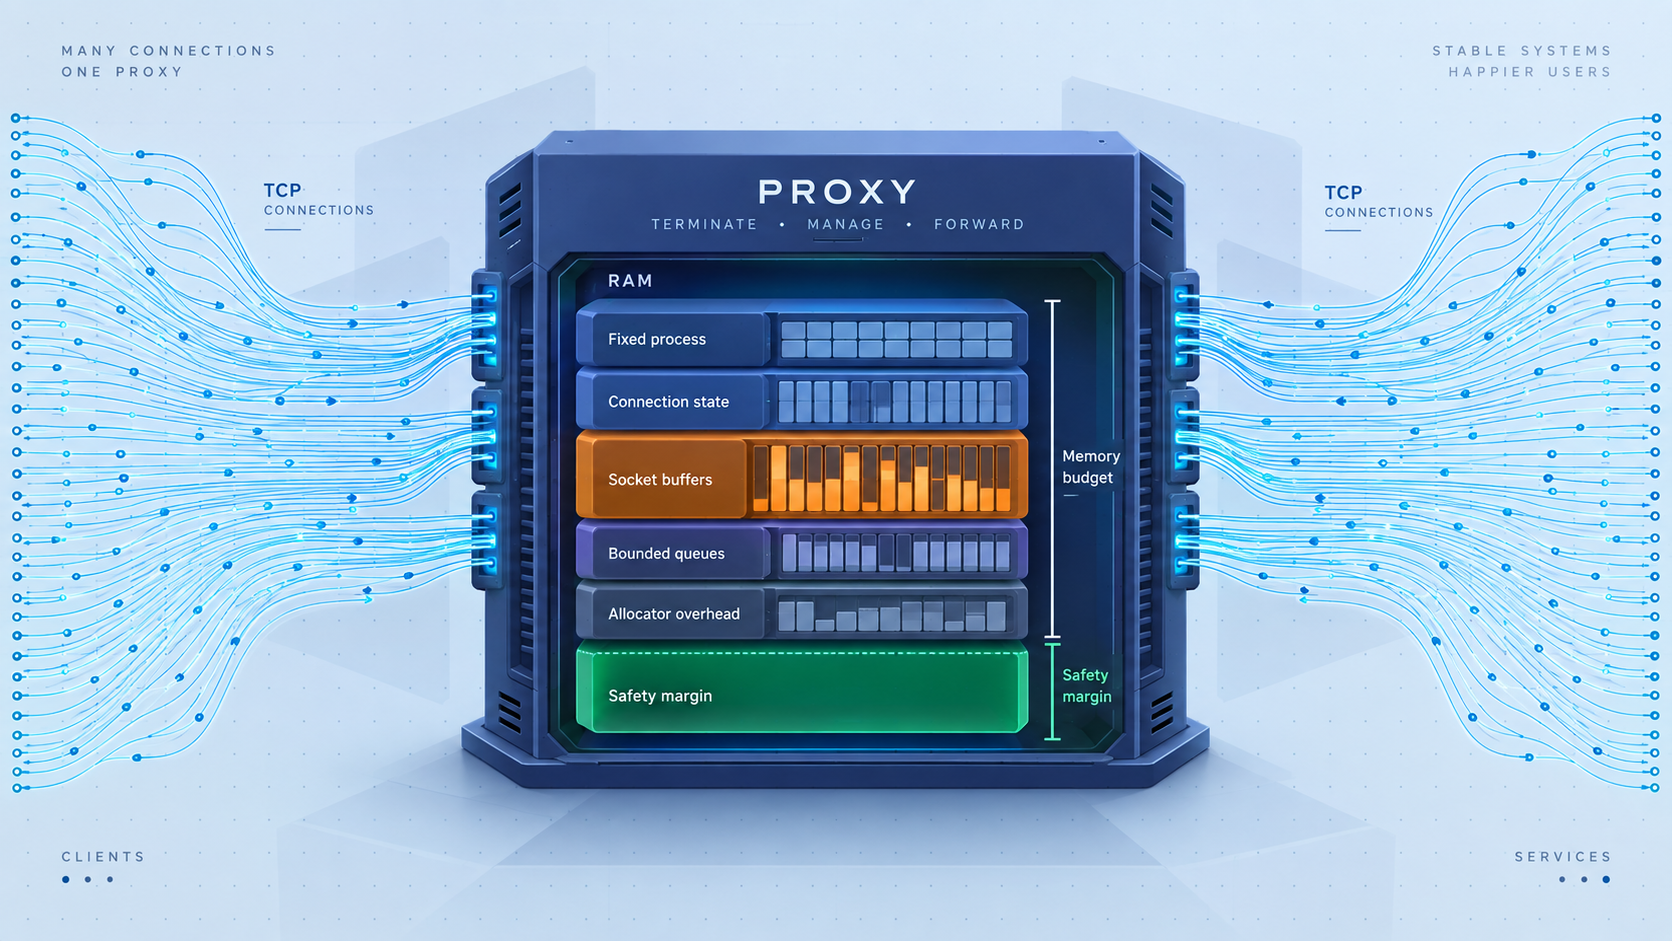
Turn connection counts, buffer behavior, and traffic percentiles into a defensible RAM budget
High-concurrency TCP proxies rarely consume memory according to a single neat per-connection constant. Idle connection state, active buffers, queued writes, allocator behavior, protocol metadata, application caches, and the operating system all contribute differently as traffic changes. In this guide, we build a measurement-driven capacity model, validate it with realistic load tests, and use bounded queues and backpressure to keep memory growth predictable. We then explain how to expose the measured local service through a Localtonet TCP tunnel without confusing local proxy memory with the behavior of our tunneling platform.
📋 What's in this guide
Build a memory model that matches how a TCP proxy works
A useful memory model starts by separating costs that remain approximately fixed from costs that scale with connections, traffic, queues, workers, and application-specific data structures. Multiplying the number of sockets by one guessed buffer size is not enough. That estimate can miss a large fixed cache, count buffers that are allocated only on demand, or ignore a slow destination that causes pending writes to accumulate.
Treat the proxy as a system with several memory owners. The process owns executable mappings, runtime state, heaps, stacks, connection objects, user-space buffers, queues, caches, and telemetry. The operating system owns socket state and kernel networking buffers. A container or service manager may report a broader memory total than the process resident set. These measurements answer different questions, so the first capacity-planning decision is which boundary matters.
A practical first model can be written as the following accounting identity. The symbols do not prescribe a particular programming language or runtime. They create categories that can be measured independently.
M_total =
    M_fixed
  + N_idle   × M_idle_connection
  + N_active × M_active_state
  + M_user_buffers
  + M_user_queues
  + M_allocator_overhead
  + M_kernel_networking
  + M_other
  + M_safety_reserve
The distinction between idle and active connections matters. An idle keep-alive connection may retain only socket handles, timers, compact metadata, and minimal buffer capacity. An active connection may simultaneously hold received bytes, transformed bytes, pending writes, protocol state, and logging context. A connection stalled behind a slow peer can consume more memory than a fast connection carrying greater total throughput because the stalled connection retains data for longer.
For a bidirectional TCP proxy, define the two directions separately. Client-to-upstream traffic and upstream-to-client traffic may have different chunk sizes, rates, and occupancy distributions. A workload that sends tiny requests and large responses is not symmetric. Assigning the same permanently committed buffer to both directions can overestimate normal use, while ignoring the high-volume direction can underestimate burst risk.
M_user_buffers =
    Σ buffer_occupancy_client_to_upstream
  + Σ buffer_occupancy_upstream_to_client

M_user_queues =
    Σ queued_bytes_client_to_upstream
  + Σ queued_bytes_upstream_to_client
Keep logical buffer limits separate from committed memory. A buffer type may reserve address space, retain previously allocated capacity, allocate lazily, or grow in classes. Two implementations with the same configured maximum can therefore show different resident memory. The model must use observed allocation and occupancy behavior rather than assuming that a configured limit is either fully resident or completely free.
Use the equation to identify memory owners and design experiments. Calibrate every important coefficient against the actual proxy build, runtime, allocator, operating system, configuration, and workload that will be deployed. Recalibrate after material code or configuration changes.
Choose the accounting boundary before collecting numbers
Process resident set size, private dirty memory, heap allocation, container memory, and host available memory are not interchangeable. Resident set size is useful for observing pages currently resident for a process, but it can include shared mappings and does not fully represent kernel socket memory. Heap profiling can identify user-space allocations, but it can omit stacks, mappings, runtime structures, and kernel allocations. Container-level accounting may be the operational limit that triggers termination, although its exact composition depends on the environment.
Use at least two views when possible: an application view that attributes allocations to code paths, and a system view that shows what the deployment boundary actually consumes. If the service runs in a memory-limited container, the container limit is the hard operational boundary. If it runs directly on a dedicated host, include the proxy, kernel networking, monitoring agents, logs, and enough operating-system reserve to avoid reclaim pressure.
Measure fixed, idle, active, and released memory separately
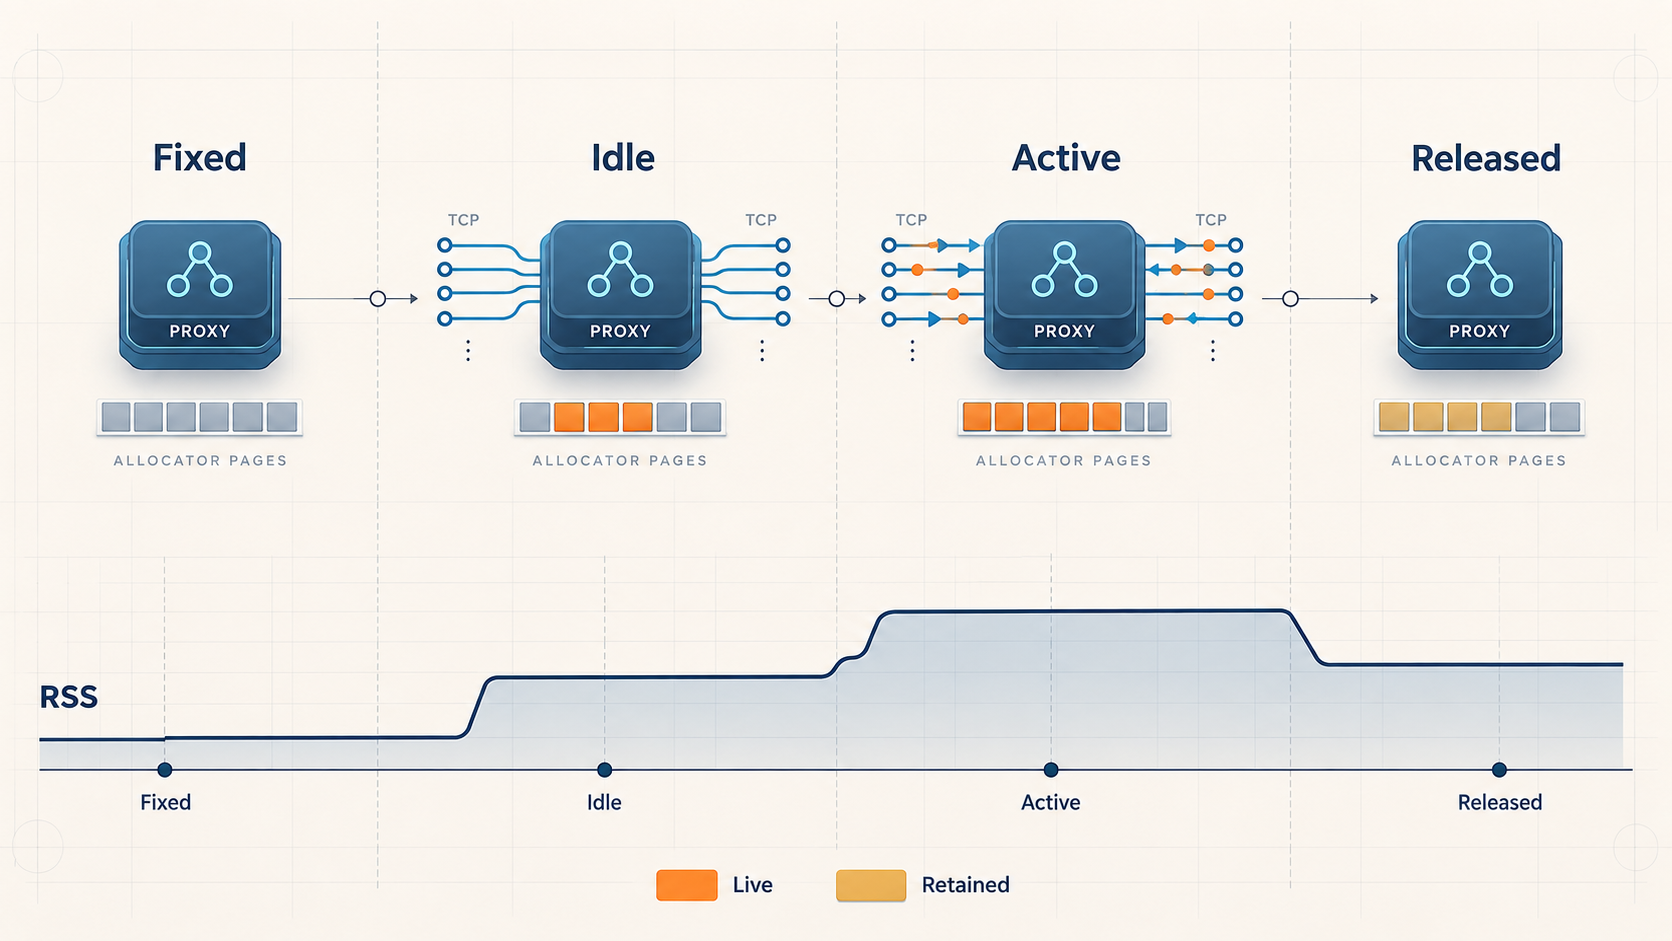
The cleanest way to estimate connection-dependent memory is to run controlled stages and compare steady-state measurements. Start from a reproducible process configuration. Keep worker count, logging level, routing tables, runtime settings, and test environment unchanged while varying one workload dimension at a time.
Establish a stable baseline
Start the proxy with no client connections and allow initialization to finish. Record process-level, container-level, and host-level memory where available. Note worker counts, caches, loaded configuration, and background activity. This produces an observed baseline rather than an assumed zero-load value.
Add idle connections in controlled batches
Establish a known number of complete proxied connections without sending sustained payload traffic. Wait for measurements to settle after each batch. Confirm that each client-side connection also created the expected upstream-side connection before attributing the memory delta.
Exercise one traffic direction at a time
Send controlled traffic from clients to the destination, then repeat for destination-to-client traffic. Use multiple payload and burst sizes. Separating directions reveals asymmetric buffer allocation and queue behavior that a full-duplex aggregate can hide.
Introduce controlled slow consumers
Reduce the receive rate on one side while maintaining production on the other. Observe whether pending bytes remain bounded, whether reads pause, and how quickly memory reaches a plateau. A test that never creates backpressure cannot validate queue limits.
Close connections and observe retention
Close a known percentage of connections, then all connections, and continue measuring. Compare live heap, resident memory, and deployment-level memory. Retained pages do not automatically prove a leak, but continued growth across repeated cycles requires investigation.
Repeat and fit a conservative model
Run each stage more than once, use medians or robust summaries to reduce noise, and estimate slopes across several connection counts. Preserve upper-percentile observations for capacity planning rather than relying only on the best run.
A simple slope estimate for idle memory is the change in measured memory divided by the change in verified idle connection count. Use endpoints that are far enough apart to dominate measurement noise, and preferably fit a line across several batches rather than trusting one subtraction.
Estimated idle bytes per connection =
    (memory_at_N2 - memory_at_N1) / (N2 - N1)
This result is only meaningful if the relationship is reasonably linear over the tested range. Step changes can occur when a runtime adds worker resources, a hash table resizes, a slab grows, or a cache reaches a new class. Plot memory against connection count and inspect the shape. A straight-line model can still be useful, but it may need an additional stepwise or nonlinear term.
Do not divide the entire process footprint by the number of connections. Doing so assigns fixed executable, runtime, and cache costs to every connection, producing a value that changes merely because concurrency changes. Subtract the stable baseline first, then check whether the resulting slope remains similar across low, medium, and high concurrency.
Distinguish retained capacity from a live leak
After a traffic spike, a proxy's resident memory may not immediately return to its startup level. An allocator can keep freed pages available for reuse, and buffers may retain capacity even after their logical length becomes zero. Runtime caches and memory arenas may also preserve high-water allocations. This can be operationally expensive, but it is not the same as unreachable memory that grows without bound.
Run repeated identical cycles. If the first cycle reaches a new plateau and later cycles reuse that capacity without materially increasing the plateau, retained capacity is a likely explanation. If each cycle adds a persistent increment, inspect object counts, tasks, connection registries, timer entries, queued messages, log buffers, and error paths. Compare application allocation profiles with deployment-level memory so that allocator retention is not mistaken for live application data.
| Measurement | What it helps answer | Important limitation |
|---|---|---|
| Process resident memory | How many process pages are currently resident | Can include shared pages and generally does not capture all kernel networking memory |
| Application heap profile | Which code paths and object types own live user-space allocations | May omit stacks, mappings, allocator bookkeeping, runtime memory, and kernel allocations |
| Container or service-group memory | How close the deployment is to its enforced memory boundary | Accounting details vary by operating system and deployment configuration |
| Host memory and kernel networking metrics | Whether socket state, socket buffers, reclaim pressure, or other services threaten the machine | Requires careful attribution when several workloads share the host |
| Application queue and buffer metrics | Whether logical occupancy explains observed growth | Configured capacity and logical bytes may differ from allocated and resident bytes |
Model buffer occupancy as a distribution, not a constant
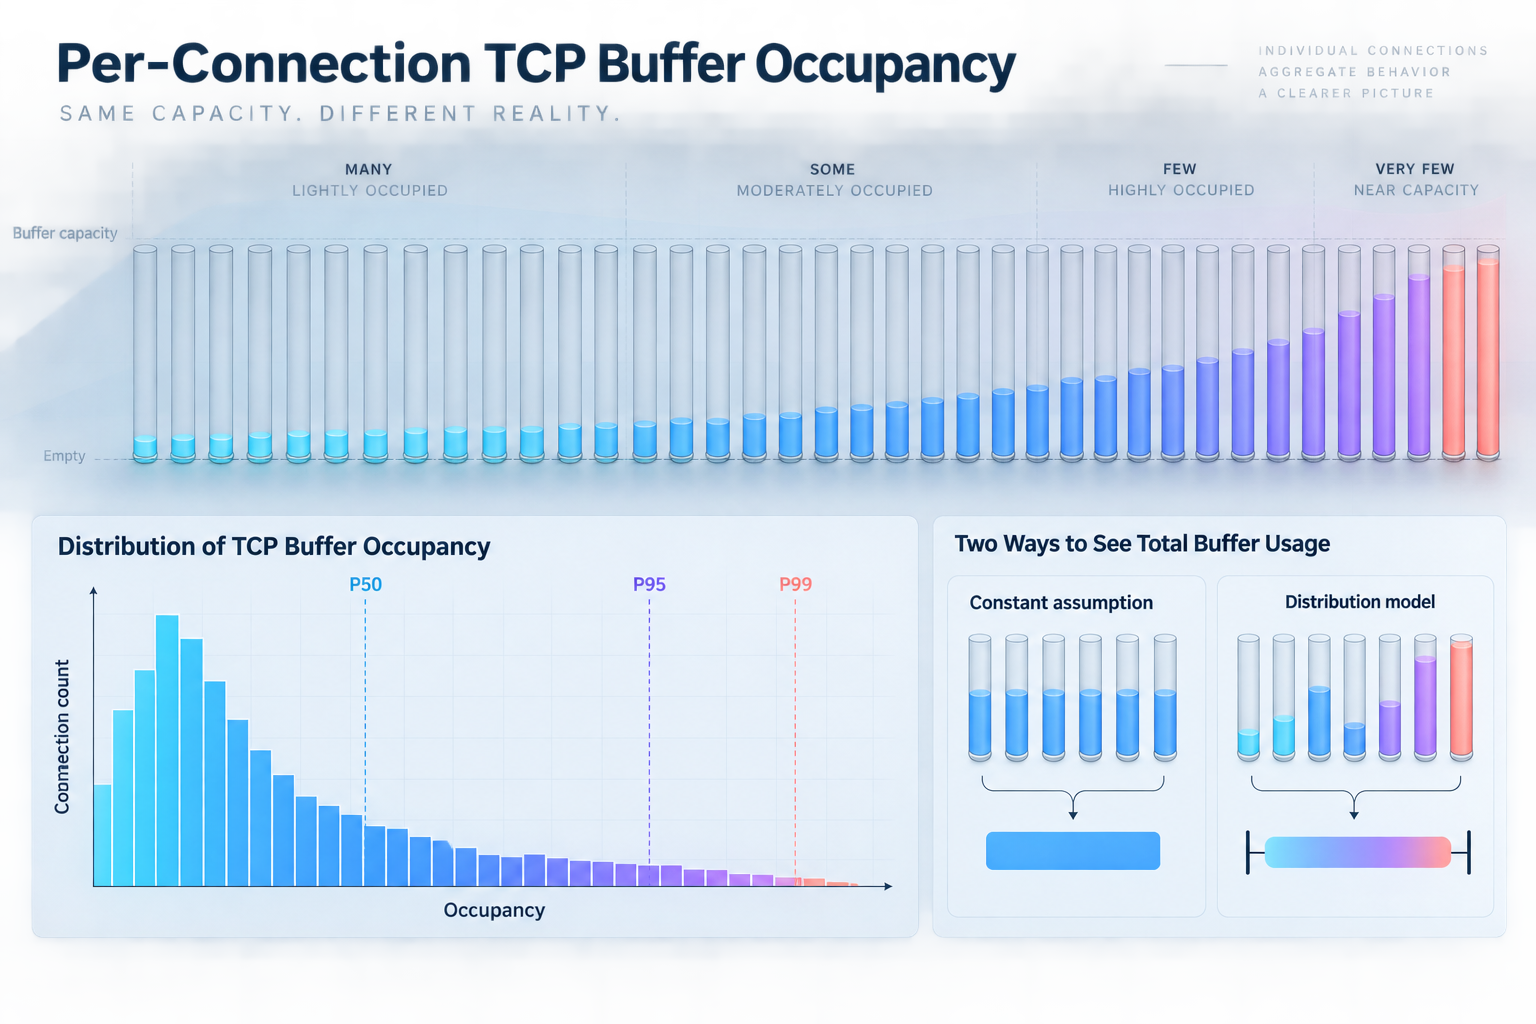
Buffer memory is often the most workload-sensitive part of a proxy. A design might permit a large buffer per direction, but normal connections may occupy only a small portion of that capacity. Conversely, an estimate based on average occupancy can fail when many connections become blocked at the same time.
Measure occupancy over time and across connections. Useful summaries include the median, p90, p95, p99, and maximum observed occupancy for each direction. Also measure the number or fraction of connections simultaneously occupying each range. A p99 per-connection value multiplied by every connection can be deliberately conservative, but it may be unrealistically high if only a small, uncorrelated subset reaches that state. Multiplying the mean by all connections can be too optimistic when congestion correlates across many flows.
A more useful model divides connections into traffic states. For example, classify them as idle, normally active, burst-active, and backpressured. Assign each class an observed upper-percentile memory cost, then model the number of simultaneous connections in each class.
M_connection_population =
    N_idle         × P95(memory | idle)
  + N_normal       × P95(memory | normal activity)
  + N_burst        × P99(memory | burst activity)
  + N_backpressure × P99(memory | backpressured)
The percentile choices are policy decisions, not universal constants. A development service may accept a smaller reserve than a production gateway with strict reliability objectives. What matters is making the decision explicit, validating it against observed distributions, and testing correlated worst cases.
Account for correlation during bursts
Traffic states are rarely independent. A downstream outage can make thousands of upstream-bound queues grow together. A large broadcast can make many client-bound queues active simultaneously. A rolling restart can trigger synchronized reconnects and handshakes. These are correlated events, and they invalidate a model that assumes only a random one percent of connections will be near p99 at the same time.
Add scenarios based on failure domains. If all connections share one slow destination, model the affected group as a cohort. If routes are partitioned across several independent destinations, model each partition separately. The right question is not only, “What is the p99 connection?” It is also, “How many connections can enter that state together?”
Use Little's Law as a diagnostic relationship
For a stable queue, the average amount of work in the system is related to arrival rate and average time in the system. Applied carefully, this relationship helps explain why memory grows when bytes wait longer even if incoming throughput does not change.
Average queued bytes ≈ byte arrival rate × average queue residence timeThis is not a license to keep an unbounded queue. It is a diagnostic tool. If a destination slows down, residence time increases. Unless the proxy reduces intake, sheds work, or applies another limit, queued bytes rise accordingly. The model therefore needs both expected occupancy and an enforced maximum.
Validate a scenario in which many connections become slow at once. If the proxy can accept data faster than destinations can drain it, an unbounded queue can convert a downstream slowdown into process-wide memory exhaustion. Bound the queue and define what happens when the limit is reached.
Control memory with bounded queues, backpressure, and admission limits
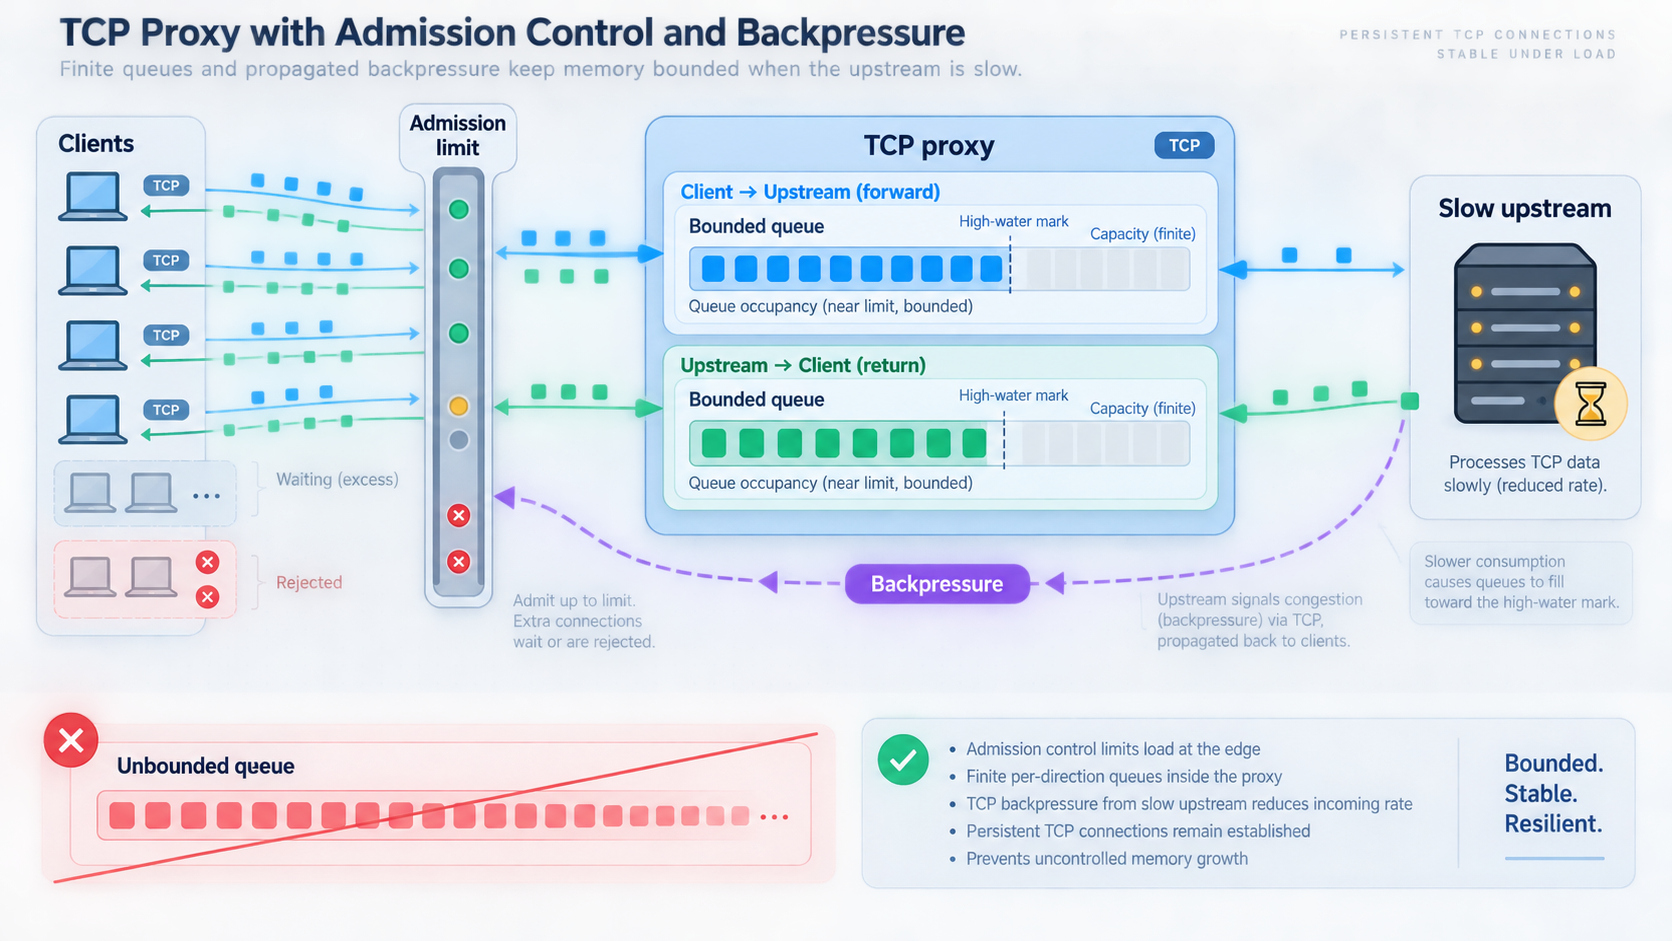
Prediction is valuable, but enforcement makes the prediction dependable. Every queue between reading and writing should have a clear owner, an observable occupancy, a finite bound, and a defined full-queue policy. A limit without backpressure may merely move bytes to another queue. For example, bounding an application channel while continuing to read indefinitely into a different buffer does not bound the connection's total memory.
Propagate backpressure through the complete data path
A robust proxy stops or reduces reads when the corresponding write path cannot keep up. The exact mechanism depends on the runtime and I/O architecture, but the principle is consistent: readiness to read should reflect capacity to retain and forward the resulting bytes. When capacity becomes available, reads can resume.
Consider both directions independently. A client may be slow to receive while still sending quickly. The upstream-to-client path should pause without unnecessarily preventing safe progress in the opposite direction, unless the application protocol or implementation requires coupling. Track directional queue occupancy so operators can identify which peer is causing retained data.
Choose a full-queue policy explicitly
Backpressure is usually the first response, but it cannot solve every condition. Peers may remain stalled indefinitely, and connection state itself consumes memory. Define timeouts or other termination policies appropriate to the application, and ensure that a closed connection releases queue entries, timers, and references. Avoid silently dropping arbitrary bytes in a generic TCP byte stream because that corrupts the stream's semantics.
Admission control protects the process before it reaches an unrecoverable state. Limits can be global, per listener, per destination, per tenant, per source policy, or a combination. The proxy should reject or defer new work predictably rather than accepting more state than its memory budget can support. The correct rejection behavior depends on the surrounding application and should be tested with real clients.
| Control | Memory effect | Trade-off to evaluate |
|---|---|---|
| Bounded directional write queue | Caps application bytes waiting for a slow peer in that direction | Requires correct backpressure and a policy for prolonged stalls |
| Lazy or pooled buffers | Can avoid committing maximum capacity for every idle connection | Pools can retain high-water memory and need their own bounds |
| Global connection limit | Caps aggregate connection state and worst-case buffer ownership | New connections may be delayed or rejected during peaks |
| Per-destination limit | Contains memory growth caused by one unhealthy upstream | Must reflect destination capacity and fairness requirements |
| Idle and stall timeouts | Releases state held by inactive or non-draining peers | Overly aggressive values can terminate legitimate slow sessions |
| Load shedding at a memory threshold | Preserves reserve for existing work and process recovery | Needs hysteresis and clear operational visibility to prevent oscillation |
Calculate a hard upper bound carefully
If every admitted connection can own two directional queues with fixed byte limits, the theoretical queue maximum is straightforward. It is not the complete process maximum because queue objects, allocation rounding, connection state, and kernel memory remain.
Maximum logical queued bytes =
    connection_limit
  × (client_to_upstream_queue_limit
  + upstream_to_client_queue_limit)
Add measured connection state and an allocator factor derived from testing. Do not invent a universal allocator multiplier. Different allocation patterns and runtimes produce different overhead. Measure the ratio between logical live bytes, allocated bytes where observable, and resident growth under the intended workload.
A queue bound should also be checked against latency. A larger queue can absorb a burst, but it permits more data to wait. A smaller queue reduces memory and queueing delay, but it can pause producers sooner and may reduce throughput if normal scheduling jitter repeatedly fills it. Test several limits and compare throughput, tail latency, pause frequency, connection failures, and memory.
Design load tests that reproduce memory pressure
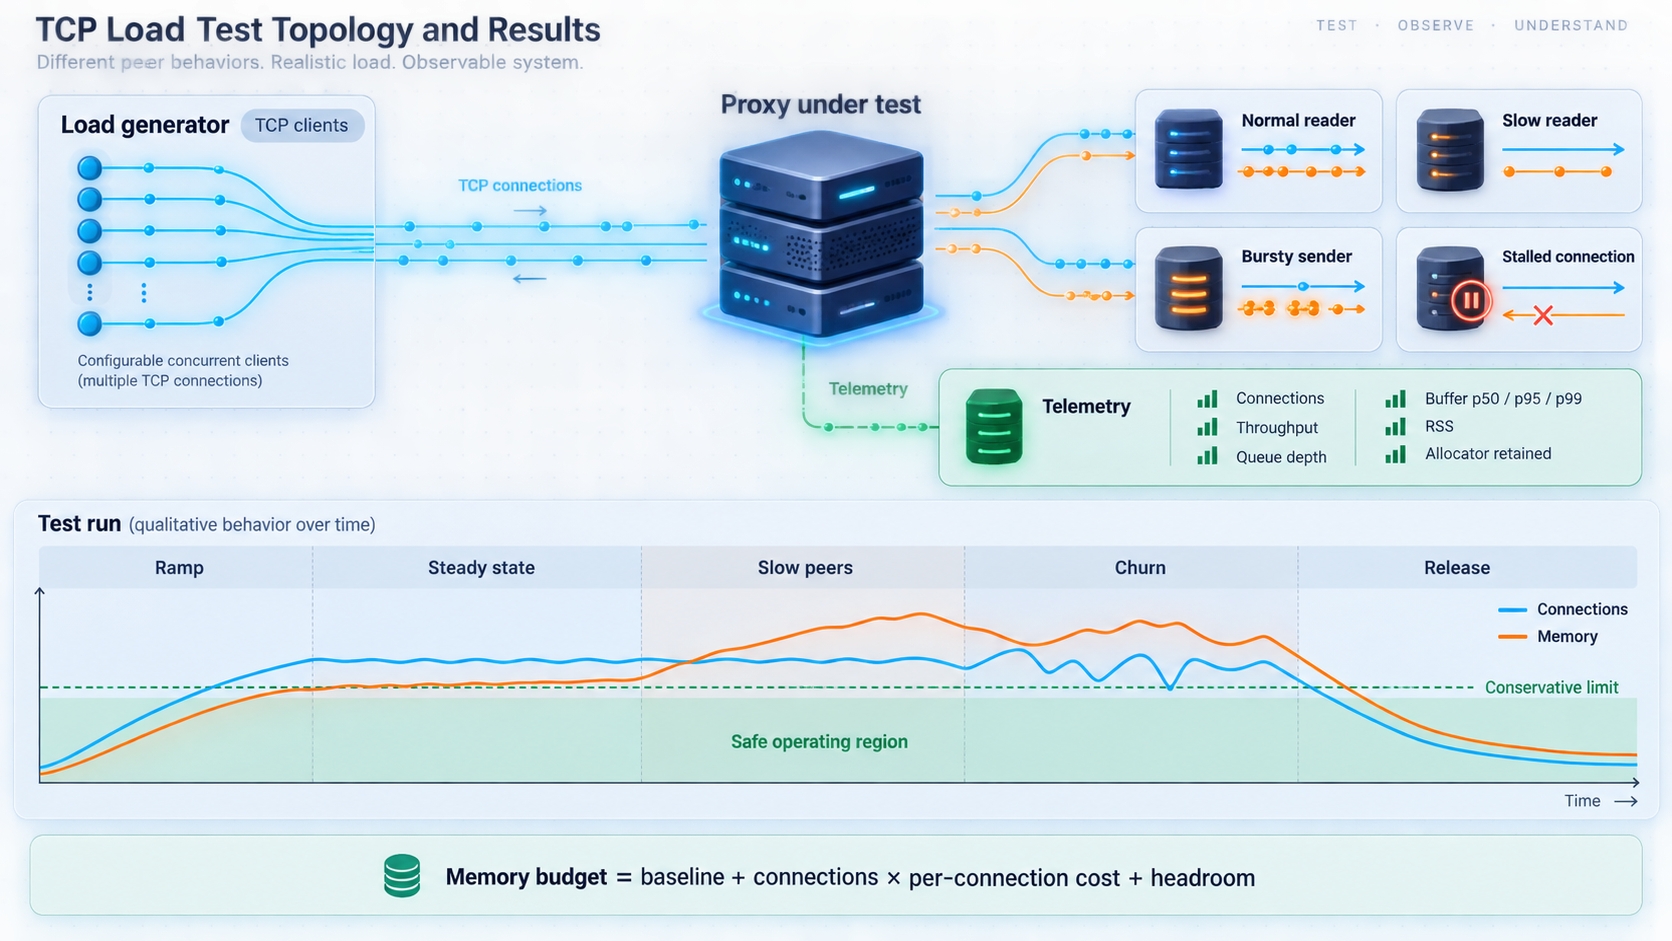
A useful memory test does more than open many connections. It reproduces connection lifetime, traffic shape, destination behavior, client receive behavior, churn, and correlated failures. The test generator must also be observed so that its own CPU, socket, or memory limit does not create misleading results.
Ramp concurrency in stages rather than jumping immediately to the target. Hold each stage long enough to distinguish transient allocation from a stable plateau. Record connection attempts, established downstream and upstream sockets, active connections, queue occupancy by direction, read pauses, write stalls, accepted and rejected connections, timeouts, throughput, latency, process memory, deployment memory, and host pressure.
Sample frequently enough to capture short peaks, but do not let high-cardinality telemetry become a major part of the workload. Per-connection labels can consume substantial memory in metrics systems and sometimes in the process itself. Prefer histograms, counters, and bounded diagnostic sampling unless individual connection tracing is specifically required.
Define pass and fail conditions before the test
A test is not successful merely because the process remains alive. Define acceptable memory plateaus, queue occupancy, throughput, tail latency, connection error rates, and recovery behavior. Include a maximum time for memory and active-state counters to return to an expected post-load range.
For a backpressure test, verify that queue growth stops at or below the intended logical limit, reads are paused as designed, and unrelated destinations continue making progress. For an admission test, confirm that the proxy begins rejecting or deferring new work before the hard deployment memory limit is reached. For a recovery test, restore the destination and verify that queues drain without a second surge caused by synchronized retries.
Validate the proxy directly on the local network before adding an internet-facing path. This isolates the memory behavior of the proxy and destination from wide-area latency, relay connectivity, and external client behavior. Add Localtonet only after the local baseline is understood.
Convert measurements into a safe connection limit
Capacity planning should work backward from the memory actually available to the proxy after subtracting fixed costs and reserves. Do not set the process limit equal to total host RAM. The operating system, kernel networking, Localtonet client, monitoring, logs, and any colocated services also require memory.
M_available_for_connections =
    M_deployment_limit
  - M_fixed_observed
  - M_kernel_and_system_reserve
  - M_operational_reserve
  - M_other_local_services

Estimated connection capacity =
    M_available_for_connections
  / M_modeled_connection_cost
The modeled connection cost should represent the planned workload mix, not merely idle state. If the service expects 80 percent idle connections, 15 percent normally active connections, and 5 percent potentially backpressured connections during a defined incident, calculate a weighted scenario using conservative observed costs. Then validate that exact mix.
Also calculate a severe but credible incident scenario. A nominal weighted average can authorize more connections than the proxy can support when one shared destination stalls. If such a stall can affect half the connections simultaneously, the connection limit must preserve enough memory for that cohort or the proxy must enforce a smaller per-destination limit.
Example with illustrative values
The following values demonstrate the method only. They are not product defaults, recommendations, benchmark results, or Localtonet limits. Replace every value with measurements from the actual deployment.
Deployment memory boundary:              16 GiB
Observed fixed proxy cost:                 1 GiB
System and kernel reserve:                 3 GiB
Operational uncertainty reserve:           2 GiB
Other local services, including client:     1 GiB
--------------------------------------------------
Available modeled connection memory:       9 GiB

Measured scenario cost per connection:
  connection state and retained capacity:  24 KiB
  expected user-space buffer occupancy:    32 KiB
  allocator allowance from testing:         8 KiB
--------------------------------------------------
Modeled user-space cost:                   64 KiB

Initial mathematical result:
  9 GiB / 64 KiB = 147,456 connections
That result is not yet a safe production limit. It excludes any kernel cost not already covered by the reserve, assumes the measured workload distribution remains valid, and may not survive a correlated slow-consumer event. The next step is to test below and around the proposed range, compare observed memory to the prediction, and reduce the limit until the required failure scenarios retain adequate headroom.
Maintain a model-versus-observed dashboard or report. For each test stage, record predicted memory, observed memory, error, connection-state mix, queue percentiles, and environment details. If error grows with concurrency, an omitted per-connection term is likely. If error appears as sudden steps, inspect pool expansion, table resizing, worker creation, or cache thresholds. If the intercept is wrong but the slope is accurate, revisit fixed costs.
Revalidate after changes
Memory coefficients can change when the runtime, allocator, operating system, TLS behavior, logging mode, metrics configuration, worker count, buffer implementation, or proxy code changes. Treat the model like performance-sensitive configuration. Version it with the deployment assumptions and rerun a smaller calibration suite for routine changes, followed by full capacity and failure testing for material changes.
Expose the measured proxy through a Localtonet TCP tunnel
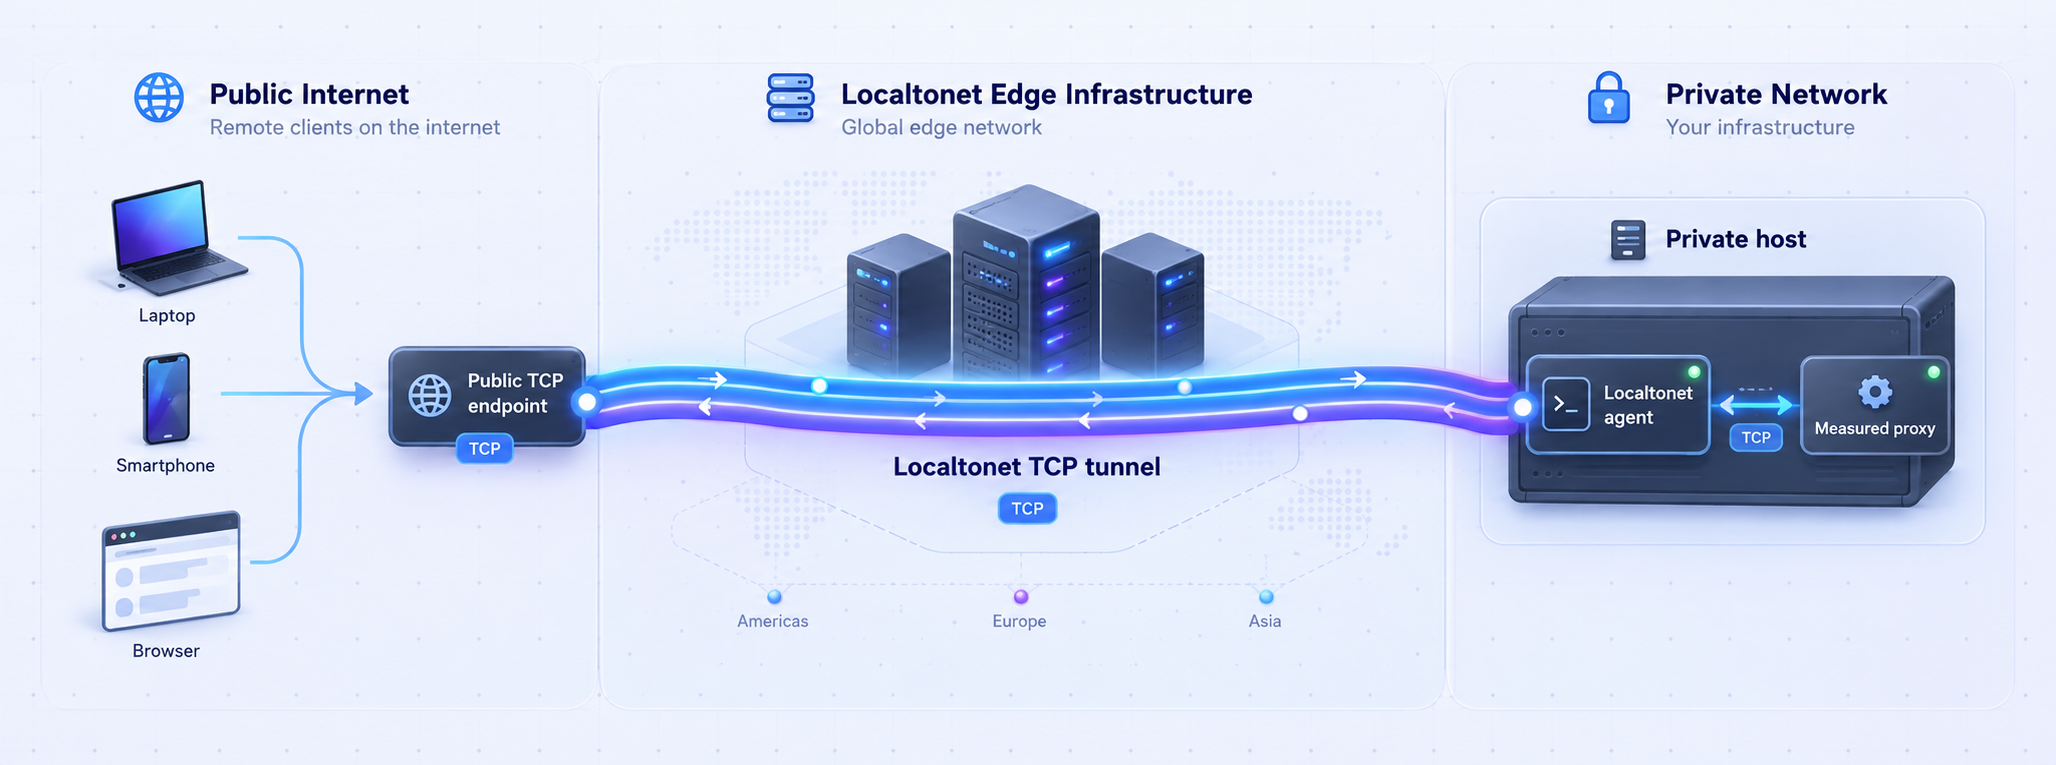
Once the local proxy has verified memory limits, queue bounds, and admission behavior, a Localtonet TCP tunnel can provide public connectivity to its listening address. Our client establishes an outbound connection to a Localtonet relay server, so the workflow does not require inbound router port forwarding, firewall changes, VPN setup, or a public IP address. The resulting TCP tunnel provides a public host and port while it is running.
The Localtonet client should run on a device that can reach the proxy's local IP address and port. If the proxy listens only on the loopback interface, the client generally needs to run on the same network namespace or device where that loopback address is reachable. If it runs elsewhere on the LAN, verify network reachability from the client device before creating public access.
A TCP tunnel makes the selected service reachable through its assigned public host and port. Before starting it, confirm that the proxied protocol has appropriate authentication, authorization, least-privilege access, safe defaults, and suitable connection limits. Do not expose an administrative or unauthenticated service merely because it works locally.
The following sequence reflects the documented Localtonet workflow at the level supported by our current product context. Dashboard labels and available relay choices can change, so obtain current server or region values from the dashboard rather than hardcoding them into automation or documentation.
Install and run the Localtonet client
Install our client on the device that can reach the local TCP proxy. Keep the proxy running and confirm its listening IP address and port locally before continuing.
Authenticate or select the client device
Use the device-specific authentication token associated with the client that will run the tunnel. Treat this token as a secret. Do not place it in screenshots, source control, test output, or public configuration examples.
Select an available relay server or region
Choose from the values currently offered in the Localtonet dashboard. Availability can vary, so this guide does not hardcode a server code or claim that every choice is included in every plan.
Create the TCP tunnel configuration
Select the TCP tunnel type and point its local target to the proxy's reachable local IP address and listening port. Recheck that the target identifies the proxy rather than an unintended service on the same machine.
Start the tunnel and use the assigned endpoint
Creating a tunnel does not mean it is running. Start it with the Start button, then connect using the public host and port assigned to that tunnel. The tunnel is available only while the selected client or device is connected and the tunnel is running.
Stop or delete access when it is no longer needed
Stop the tunnel to remove active public reachability while retaining the configuration, or delete it when the configuration is no longer required. Include this lifecycle step in temporary test and review procedures.
Localtonet and the local proxy are separate memory consumers. The proxy owns its connection objects, user-space buffers, application queues, protocol processing, and destination connections. The Localtonet client is another local process with its own resource use. Host-level planning must include both, but a change in the proxy's resident memory should not be attributed automatically to the tunnel.
Repeat a subset of the load suite through the public endpoint after the local tests pass. Compare concurrency, throughput, queue occupancy, memory, and connection errors against the local baseline. Wide-area clients can have different latency and receive rates, which may alter how long proxy buffers remain occupied. The purpose of this phase is not to invent a new proxy model, but to verify that the workload distribution used by the model still represents the publicly reachable path.
Do not claim that the tunnel itself fixes an unbounded local queue. If clients can drive the local proxy into an unsafe state, correct the proxy's buffering, backpressure, admission, and authorization policies before public exposure. Localtonet provides the connectivity layer, while the service remains responsible for its own protocol behavior and resource controls.
Troubleshoot differences between predicted and observed memory
Memory grows faster than the connection count predicts
First check whether active and backpressured connections increased faster than total connections. Inspect directional queue occupancy, buffered bytes, destination latency, client receive rate, and logging volume. Then check for per-connection tasks, timers, metadata, and metrics labels omitted from the model. If the slope increases only after thresholds, look for table resizing, pool expansion, cache growth, or additional workers.
Logical queue bytes are low, but resident memory remains high
Compare live application allocations with resident memory. Empty buffers may retain capacity, pooled objects may remain available, and allocators may keep pages mapped for reuse. Repeat the same workload cycle. A stable high-water plateau suggests retention or pooling; a new increase after every identical cycle suggests unreleased live state or continuing fragmentation.
Memory falls locally but not at the container or host boundary
The broader boundary may include kernel networking state, the Localtonet client, monitoring agents, filesystem cache, or other processes. Confirm which accounting view triggered the alert. Inspect socket lifecycle and allow time for normal protocol and operating-system cleanup, but do not assume that every delayed release is harmless. If the operational memory boundary remains close to its limit, reduce admitted load or increase verified headroom.
Only public tests trigger high memory
Compare client latency, client read speed, connection duration, retransmission symptoms, and destination behavior between local and public runs. Public clients may remain connected longer or consume data more slowly, shifting connections into a higher-memory state. Preserve the queue bounds and admission controls, then recalibrate the workload mix using observations from representative authorized clients.
The TCP tunnel is configured but the endpoint is unavailable
Confirm that the local proxy is running and listening on the exact IP address and port configured as the local target. Verify that the Localtonet client device can reach that target. Then confirm that the intended device is connected, its device-specific token was selected correctly, and the tunnel was explicitly started. Remember that creating the configuration alone does not start it.
The process reaches its limit before the theoretical maximum
Revisit omitted costs rather than forcing more connections. Kernel memory, runtime stacks, connection setup bursts, allocator overhead, DNS or routing caches, observability, and local companion processes can all consume the reserve. Check whether the test generator created a more severe state mix than the mathematical example assumed. Capacity should be based on the validated operational boundary, not on an idealized division.
Frequently asked questions
How do I calculate TCP proxy memory per connection?
Measure a stable no-connection baseline, add verified idle connections in several controlled batches, and estimate the slope of memory versus connection count. Repeat with normal traffic, bursts, and backpressured traffic because active buffer and queue costs are workload-dependent. Do not divide total process memory by connection count, since that incorrectly assigns fixed process costs to each connection.
Should I multiply the maximum buffer size by every connection?
Use that multiplication to understand a possible logical upper bound when every connection can own the full buffer simultaneously. For expected capacity, measure actual occupancy distributions and the number of connections that enter each traffic state together. Keep the hard bound in the safety analysis because correlated congestion can make many queues grow at once.
Why does proxy memory stay high after connections close?
Buffers, pools, runtime caches, and allocators can retain capacity for reuse even after logical data is released. Compare live allocation profiles with resident memory and run repeated identical cycles. A reusable plateau differs from persistent live growth, although retained memory still matters if it keeps the deployment close to its enforced limit.
Does backpressure guarantee bounded memory?
Not by itself. Backpressure must propagate through the entire path so that the proxy stops reading when it has no bounded place to retain more bytes. Every intermediate queue must also be finite. Connection admission limits, stall handling, timeouts, cleanup, and reserves for kernel and runtime memory are still necessary.
Should capacity planning use average or p99 buffer occupancy?
Use a state-based model rather than choosing one statistic for every connection. Apply measured percentiles to idle, normal, burst, and backpressured cohorts, then test credible correlated incidents. Averages can hide dangerous tails, while multiplying a per-connection p99 by all connections may be unnecessarily conservative unless the workload can drive them into that state together.
Does a Localtonet TCP tunnel change the proxy's buffer limits?
No Localtonet-specific proxy buffer tuning control is established by the supplied product information, so this guide does not claim one. The local proxy remains responsible for its own queues, buffers, backpressure, connection limits, and destination behavior. Our TCP tunnel provides public host-and-port connectivity to the configured local target while the selected client and tunnel are running.
Can I expose the proxy before completing the load test?
It is safer to establish the local baseline, enforce bounded queues, validate backpressure, configure admission limits, and confirm application authentication first. After those controls pass locally, start the TCP tunnel and repeat representative tests through the public endpoint. Stop the tunnel when temporary testing is complete.
Does Localtonet require router port forwarding for this workflow?
No. Our client establishes an outbound connection to a Localtonet relay server, allowing the TCP service to receive an assigned public host and port without inbound router port forwarding, firewall changes, VPN setup, or a public IP address. The tunnel remains available only while its selected client is connected and the tunnel is running.
Expose your measured TCP proxy with Localtonet
After you have verified bounded buffers, backpressure, admission control, authentication, and recovery behavior, use our TCP tunnel workflow to provide public host-and-port access without configuring inbound router port forwarding.
Get Started Free →