

Turn real browser visits into comparable performance evidence before deployment
A page that feels fast on a development computer can behave differently when another device reaches it over the public internet. This guide builds a complete Real User Monitoring workflow using Node.js, Express, the web-vitals package, a validated /rum collector, newline-delimited JSON storage, and a reproducible percentile report. You will compare controlled localhost and Localtonet HTTP tunnel cohorts without treating one small test as population-level field data. The workflow also covers authentication, Origin validation, rate limiting, data minimization, local verification, tunnel cleanup, and the limits of browser telemetry.
📋 What's in this guide
Why measure real browser visits through a localhost tunnel?
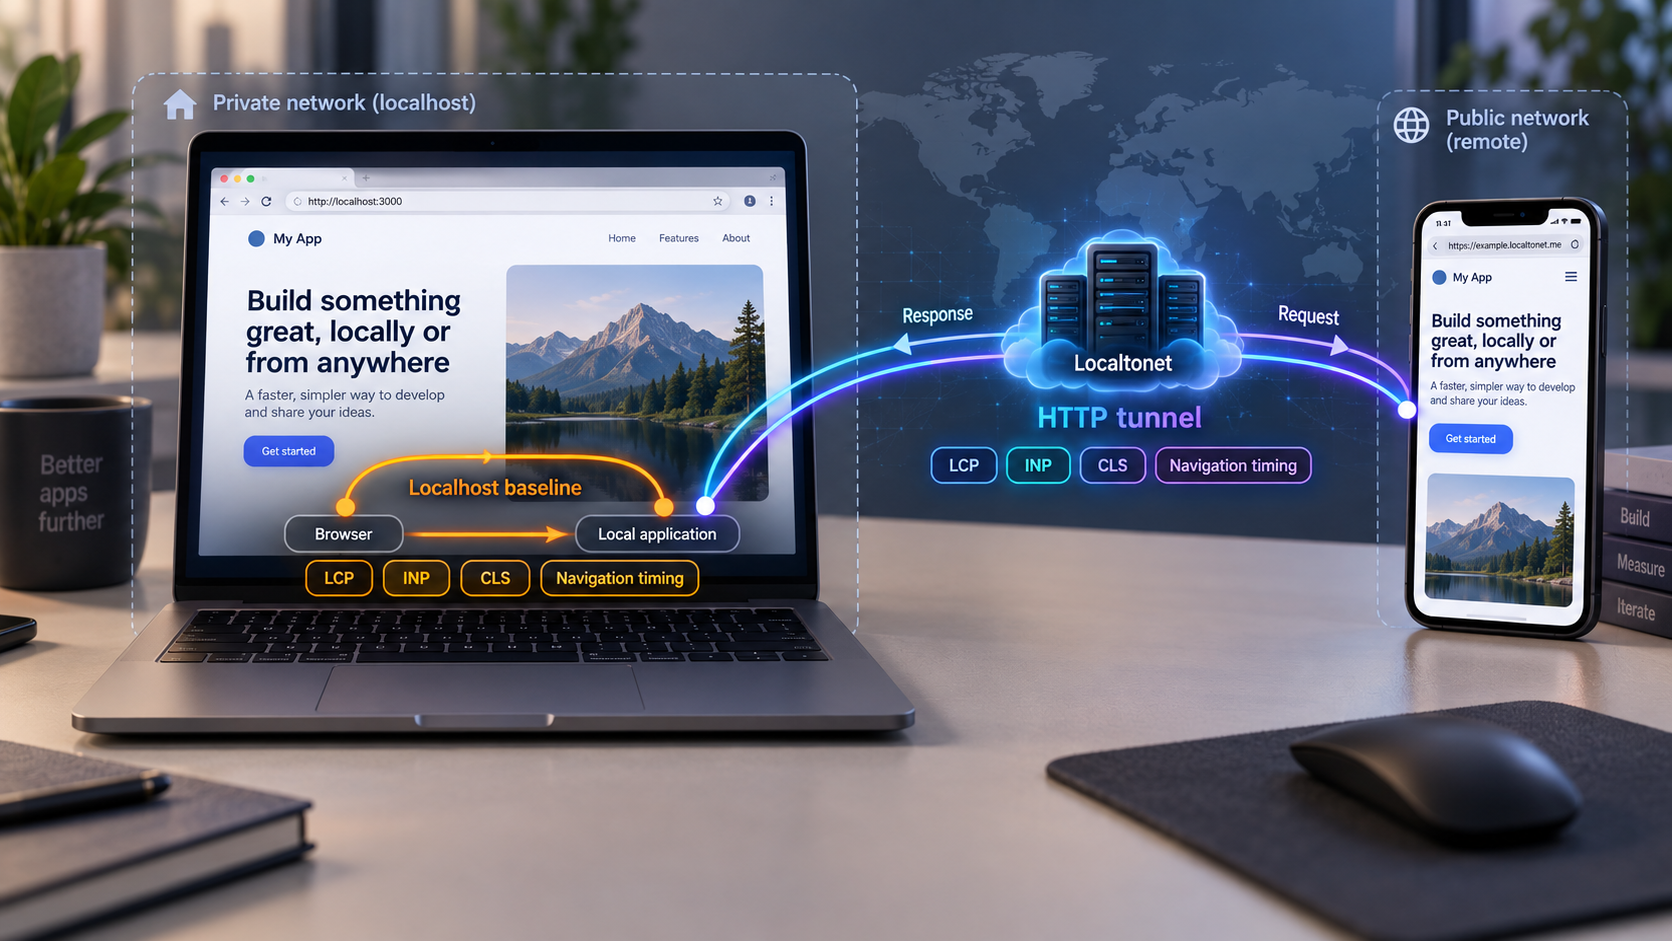
Local development removes much of the path that a normal visitor must traverse. A browser connecting to localhost avoids a public internet route, remote relay, variable access network, and many device conditions that affect real users. The development computer may also have a fast processor, ample memory, a warm browser cache, and few competing applications. A page can therefore look healthy locally while delivering a slower or less stable experience on an ordinary phone or remote laptop.
Real User Monitoring, commonly shortened to RUM, records performance observations inside the browser that loaded and interacted with the page. This differs from a single synthetic run. Synthetic testing provides controlled and repeatable conditions, which makes it useful for debugging and regression detection. RUM shows a distribution of experiences across actual browsers, devices, networks, routes, cache states, and user actions.
A Localtonet HTTP tunnel provides a useful predeployment stage. Our client establishes an outbound connection from a device that can reach the development service to a Localtonet relay server. The running tunnel supplies a public URL without inbound router port forwarding, firewall changes, VPN setup, or a public IP address. The tunnel remains available only while the selected client is connected and the tunnel is running.
That public route lets a phone on mobile data, a remote teammate, or a controlled browser device reach the same local build. These results do not predict every future production deployment. They describe a specific test architecture: the browser, its current network, the public route, the Localtonet relay path, the client connection, and the local application behind it.
Results describe the selected devices, networks, application build, relay choice, and test procedure. Do not present the observed difference as a universal Localtonet latency figure or as a production performance guarantee.
Prerequisites and reference stack
This tutorial uses one clearly defined stack so the collector can be run as written: Node.js 20 or later, npm, Express, Zod, express-rate-limit, HTTP Basic authentication, and newline-delimited JSON storage. The browser instrumentation uses the maintained web-vitals library. The sample server hosts both the test page and the /rum endpoint, so telemetry remains same-origin through localhost and the tunnel.
You also need a Localtonet account, the Localtonet client for the device that can reach the Node.js service, and permission to expose the test application. Do not use production customer records. Prepare synthetic or sanitized test data and a dedicated test account if your real application has its own user system.
Project layout
rum-tunnel-test/
├── package.json
├── server.mjs
├── aggregate.mjs
├── data/
└── public/
    ├── index.html
    └── rum.js
Create the project and install dependencies
mkdir rum-tunnel-test
cd rum-tunnel-test
npm init -y
npm install express express-rate-limit zod web-vitals
mkdir public data
Add module mode and startup scripts to package.json. Keep the dependency versions generated by npm rather than replacing them with unverified version numbers from this article.
{
  "name": "rum-tunnel-test",
  "private": true,
  "type": "module",
  "scripts": {
    "start": "node server.mjs",
    "report": "node aggregate.mjs"
  },
  "dependencies": {
    "express": "*",
    "express-rate-limit": "*",
    "web-vitals": "*",
    "zod": "*"
  }
}
The initial npm install command writes resolved dependency ranges into the real project file and creates a lock file. Keep those generated values and commit the lock file if this test project is maintained. The wildcard entries above describe the required package names, not a recommendation to discard locked versions.
Design matching local and tunneled cohorts
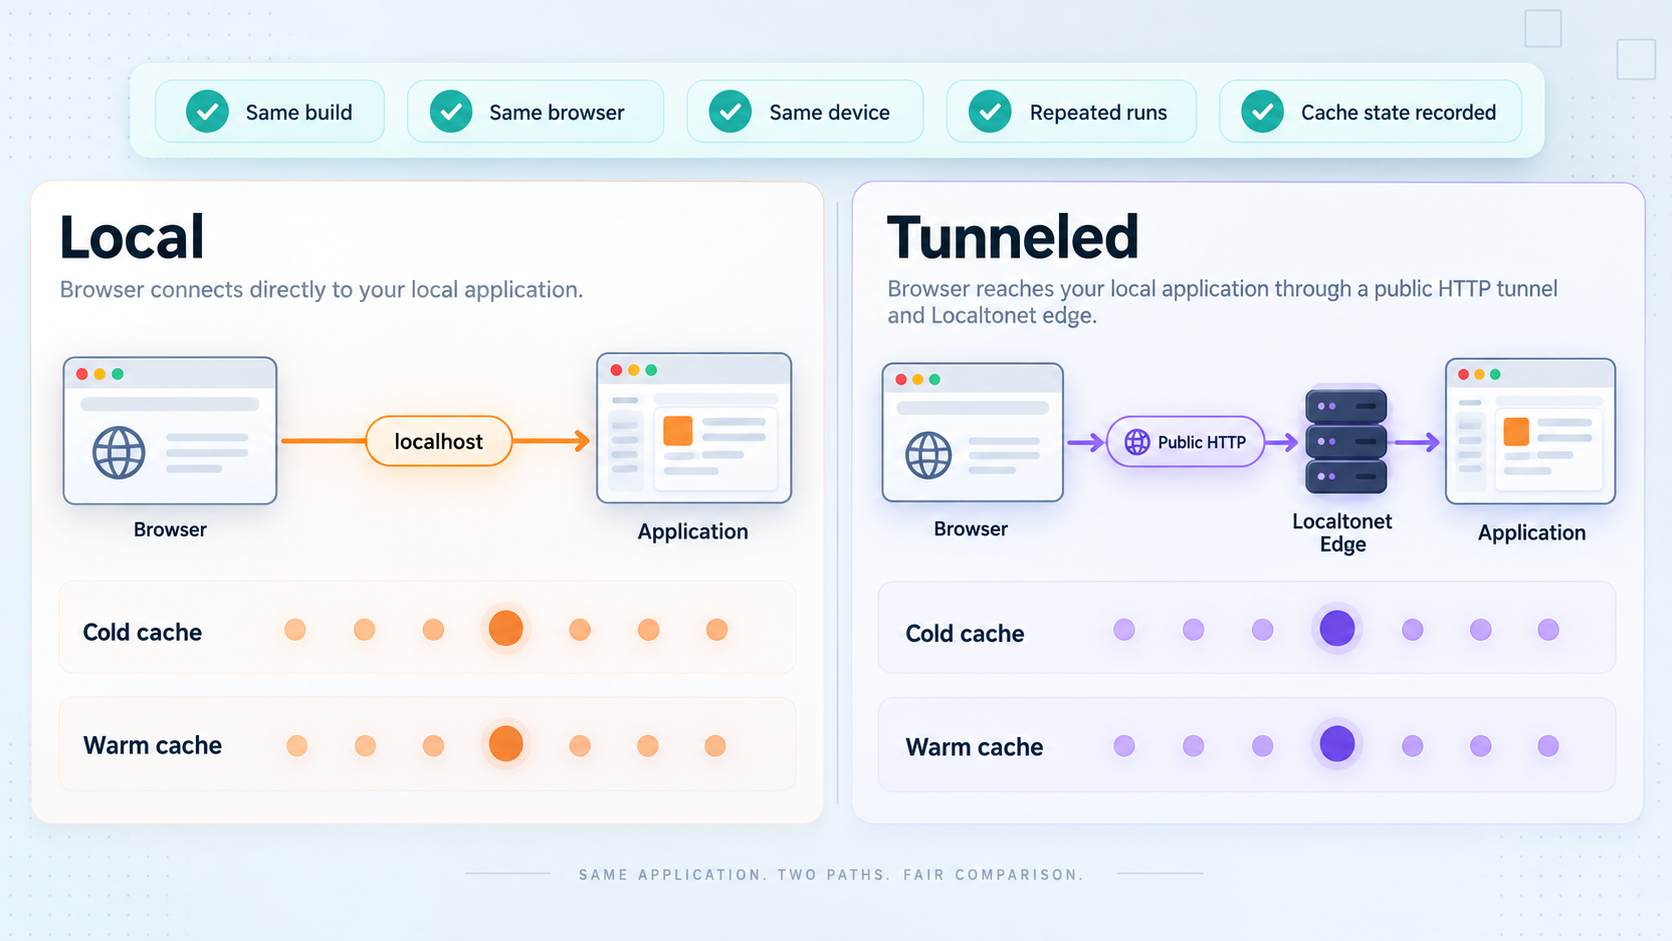
Start with a specific question. “Is the site fast?” is too broad. Better questions include: “Does the initial dashboard route have a higher LCP through the public route?”, “Does document response time increase while post-response rendering remains similar?”, or “Does a planned interaction remain responsive on a phone?”
Every record in the reference implementation includes the dimensions needed to build matching cohorts:
- Exposure:
localortunnel. - Scenario: a controlled name such as
landing-loadordashboard-open-panel. - Cache state:
cold,warm, orunknown. - Build: a controlled release or commit label supplied by the application.
- Route: a normalized route group rather than a complete URL.
- Browser family: a coarse family such as Chromium, Firefox, or Safari.
- Viewport: a small, medium, or large category.
- Network: an optional tester-selected coarse label.
- Page-view ID: a random, short-lived value used only to associate records emitted by one document visit.
The page-view value is created in memory when a document loads. It is not stored in a cookie or reused across visits. It lets the analysis associate one navigation record with LCP, CLS, and INP observations from the same page without introducing a persistent user identifier. It still enables short-range correlation inside the retained dataset, so it should be protected, retained briefly, and omitted if the experiment does not require visit-level association.
Separate initial navigation from soft navigation
The Navigation Timing API describes the initial document navigation. The reference code does not claim to measure framework-specific client-side soft navigations. A single-page application can perform substantial work during the landing page and then navigate without loading another document. Keep initial page loads in their own scenario. Add framework-aware soft-navigation instrumentation separately if that is part of the test objective.
Define cold and warm cache procedures
For a controlled cold-cache run, use an isolated browser profile or the browser’s supported cache-clearing workflow before each visit. For a warm-cache run, revisit the route without clearing reusable resources. The browser cannot reliably infer your experimental intention, so the example reads the intended cache state from a controlled page configuration.
| Cohort | Keep constant | What it helps reveal |
|---|---|---|
| Same device, localhost | Build, browser, route, scenario, data, viewport, cache state | A low-network-overhead baseline |
| Same device, tunnel URL | The same controlled dimensions | The difference associated with using the public route in that setup |
| Remote laptop through tunnel | Build, route, scenario, test data, cache procedure | A realistic off-device desktop experience |
| Phone on mobile data | Build, route, scenario, test data, cache procedure | The combined experience of mobile hardware and a mobile access network |
A warm desktop localhost visit and a cold mobile tunnel visit differ in device, browser, cache, and network. Use paired cohorts to isolate the access-path change, then use broader remote testing to study realistic variation.
Build a complete, validated RUM collector
The collector below performs Basic authentication, exact Origin validation, a 16 KB JSON body limit, strict schema validation, rate limiting, server receipt timestamps, and append-only newline-delimited JSON persistence. It accepts only known record types and fields. The server receipt timestamp is authoritative for ingestion order. The optional client timestamp is retained only as contextual browser time because a client clock can be wrong or manipulated.
Create server.mjs:
import express from 'express';
import { rateLimit } from 'express-rate-limit';
import { z } from 'zod';
import { appendFile, mkdir } from 'node:fs/promises';
import { timingSafeEqual } from 'node:crypto';
import path from 'node:path';
import { fileURLToPath } from 'node:url';

const app = express();
const port = Number(process.env.PORT || 3000);
const basicUser = process.env.BASIC_USER;
const basicPass = process.env.BASIC_PASS;
const dataFile = process.env.RUM_DATA_FILE || './data/rum.ndjson';

if (!basicUser || !basicPass) {
  throw new Error('BASIC_USER and BASIC_PASS are required');
}

const allowedOrigins = new Set(
  (process.env.ALLOWED_ORIGINS || 'http://localhost:3000')
    .split(',')
    .map((value) => value.trim())
    .filter(Boolean)
);

const __dirname = path.dirname(fileURLToPath(import.meta.url));

function safeEqual(left, right) {
  const a = Buffer.from(left);
  const b = Buffer.from(right);

  return a.length === b.length && timingSafeEqual(a, b);
}

function requireBasicAuth(req, res, next) {
  const authorization = req.get('authorization') || '';
  const match = authorization.match(/^Basic (.+)$/i);

  if (!match) {
    res.set('WWW-Authenticate', 'Basic realm="RUM test"');
    return res.status(401).end();
  }

  let decoded;

  try {
    decoded = Buffer.from(match[1], 'base64').toString('utf8');
  } catch {
    return res.status(401).end();
  }

  const separator = decoded.indexOf(':');

  if (separator < 0) {
    return res.status(401).end();
  }

  const user = decoded.slice(0, separator);
  const pass = decoded.slice(separator + 1);

  if (!safeEqual(user, basicUser) || !safeEqual(pass, basicPass)) {
    return res.status(401).end();
  }

  next();
}

function requireAllowedOrigin(req, res, next) {
  const origin = req.get('origin');

  if (!origin || !allowedOrigins.has(origin)) {
    return res.status(403).json({ error: 'origin_not_allowed' });
  }

  next();
}

const commonSchema = {
  schemaVersion: z.literal(1),
  exposure: z.enum(['local', 'tunnel']),
  scenario: z.string().min(1).max(64).regex(/^[a-z0-9-]+$/),
  cacheState: z.enum(['cold', 'warm', 'unknown']),
  build: z.string().min(1).max(80).regex(/^[A-Za-z0-9._-]+$/),
  route: z.enum(['landing', 'dashboard', 'item-detail', 'other']),
  browserFamily: z.enum(['chromium', 'firefox', 'safari', 'other']),
  viewport: z.enum(['small', 'medium', 'large']),
  network: z.enum(['office-wifi', 'home-wifi', 'mobile-data', 'other', 'unknown']),
  pageViewId: z.string().uuid(),
  clientRecordedAt: z.string().datetime().optional()
};

const webVitalSchema = z.object({
  ...commonSchema,
  recordType: z.literal('web-vital'),
  metric: z.enum(['LCP', 'CLS', 'INP']),
  value: z.number().finite().min(0).max(3600000),
  delta: z.number().finite().min(0).max(3600000),
  rating: z.enum(['good', 'needs-improvement', 'poor']),
  metricId: z.string().min(1).max(128),
  navigationType: z.string().min(1).max(32)
}).strict();

const nullableDuration = z.number().int().min(0).max(3600000).nullable();
const nullableSize = z.number().int().min(0).max(1073741824).nullable();

const navigationSchema = z.object({
  ...commonSchema,
  recordType: z.literal('navigation'),
  navigationType: z.string().min(1).max(32),
  redirect: nullableDuration,
  dns: nullableDuration,
  connection: nullableDuration,
  tls: nullableDuration,
  requestToFirstByte: nullableDuration,
  responseDownload: nullableDuration,
  responseStartFromNavigation: nullableDuration,
  domInteractive: nullableDuration,
  domContentLoaded: nullableDuration,
  loadEvent: nullableDuration,
  transferSize: nullableSize,
  encodedBodySize: nullableSize,
  decodedBodySize: nullableSize
}).strict();

const rumSchema = z.discriminatedUnion('recordType', [
  webVitalSchema,
  navigationSchema
]);

const rumLimiter = rateLimit({
  windowMs: 60 * 1000,
  limit: 120,
  standardHeaders: true,
  legacyHeaders: false
});

app.disable('x-powered-by');
app.use(requireBasicAuth);
app.use(express.static(path.join(__dirname, 'public')));

app.post(
  '/rum',
  rumLimiter,
  requireAllowedOrigin,
  express.json({
    limit: '16kb',
    strict: true,
    type: 'application/json'
  }),
  async (req, res) => {
    const result = rumSchema.safeParse(req.body);

    if (!result.success) {
      return res.status(400).json({
        error: 'invalid_payload',
        issues: result.error.issues.map((issue) => ({
          path: issue.path.join('.'),
          code: issue.code
        }))
      });
    }

    const storedRecord = {
      serverReceivedAt: new Date().toISOString(),
      ...result.data
    };

    try {
      await appendFile(dataFile, `${JSON.stringify(storedRecord)}\n`, {
        encoding: 'utf8',
        mode: 0o600
      });

      return res.status(204).end();
    } catch (error) {
      console.error('Unable to persist RUM record', error);
      return res.status(503).json({ error: 'storage_unavailable' });
    }
  }
);

app.use((error, req, res, next) => {
  if (error?.type === 'entity.too.large') {
    return res.status(413).json({ error: 'payload_too_large' });
  }

  if (error instanceof SyntaxError && 'body' in error) {
    return res.status(400).json({ error: 'invalid_json' });
  }

  next(error);
});

await mkdir(path.dirname(dataFile), { recursive: true });

app.listen(port, '0.0.0.0', () => {
  console.log(`RUM test app listening on http://localhost:${port}`);
  console.log(`Accepted Origins: ${[...allowedOrigins].join(', ')}`);
});
Why these controls matter
Basic authentication protects both the application and collector in this reference stack. Exact Origin validation prevents a different website from submitting authenticated cross-origin telemetry through a visitor’s browser. The request body is limited before schema validation, unknown fields are rejected, and accepted strings and numbers have explicit bounds. Rate limiting reduces accidental loops and basic abuse, but it is not a substitute for authentication or request validation.
This reference does not use cookie sessions. If you integrate the endpoint into a cookie-authenticated application, retain strict Origin checking and apply the application’s CSRF defense. One common design is to include a server-generated, session-bound CSRF token in the telemetry request. Do not assume that SameSite cookies alone cover every deployment or browser behavior.
Newline-delimited JSON is a deliberately minimal data sink for a bounded experiment. Each accepted record is appended as one line. It is not intended to replace a production telemetry database, retention policy, backup strategy, or multi-process ingestion system.
Add browser instrumentation and understand metric lifecycle
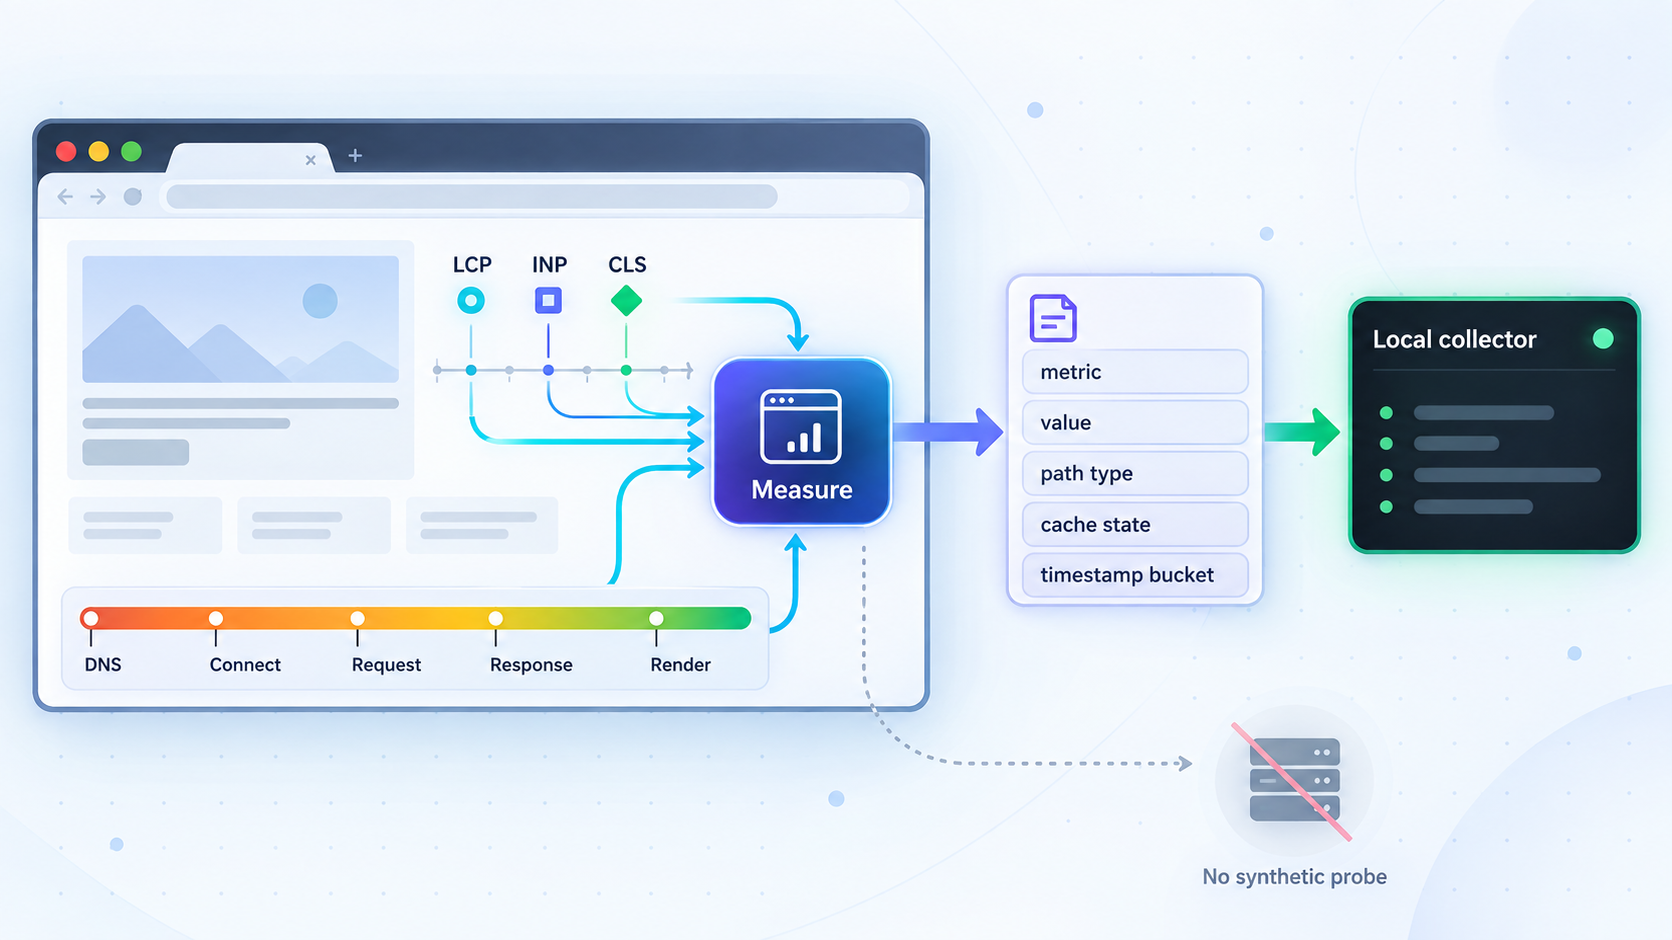
The Core Web Vitals cover three dimensions. Largest Contentful Paint, or LCP, measures loading performance. Cumulative Layout Shift, or CLS, measures visual stability. Interaction to Next Paint, or INP, measures interaction responsiveness. The current “good” thresholds are LCP at or below 2.5 seconds, CLS at or below 0.1, and INP at or below 200 milliseconds. The recommended field-assessment framing is to meet the good threshold at the 75th percentile of page views, segmented across mobile and desktop where applicable. See the primary Core Web Vitals guidance for definitions, thresholds, and assessment details.
| Metric | Good threshold | What it represents |
|---|---|---|
| LCP | 2.5 seconds or less | Loading performance of the largest visible content candidate |
| CLS | 0.1 or less | Unexpected visual instability |
| INP | 200 milliseconds or less | Interaction responsiveness across the page visit |
These thresholds are designed for field assessment at scale. A small predeployment experiment can reveal regressions and large differences, but its P75 is not automatically a stable description of a user population. Always publish the sample count beside a percentile and distinguish the test sample from production field data.
Web Vitals callbacks do not all occur at the same moment. Metrics can become reportable or finalize at different lifecycle points. LCP and CLS can change while the page remains active. INP requires a qualifying interaction and can evolve as later interactions occur. The web-vitals library handles metric calculation and lifecycle behavior, but a page closed abruptly may still fail to deliver its final record.
The Beacon API is intended for small asynchronous analytics submissions around page lifecycle transitions, but delivery remains best effort. A successful return from navigator.sendBeacon() means the browser queued the data, not that the server persisted it. Review the primary Beacon specification for delivery semantics. The fallback below uses fetch() with keepalive only when the browser refuses to queue the beacon.
Create the test page
Create public/index.html. Change the controlled values before each test cohort rather than deriving them from arbitrary user input.
<!doctype html>
<html lang="en">
<head>
  <meta charset="utf-8">
  <meta name="viewport" content="width=device-width, initial-scale=1">
  <meta name="rum-scenario" content="landing-load">
  <meta name="rum-cache-state" content="unknown">
  <meta name="rum-build" content="dev-build-1">
  <meta name="rum-network" content="unknown">
  <title>RUM tunnel test</title>
</head>
<body>
  <main>
    <h1>RUM tunnel test</h1>
    <p>Load this page locally and through the tunnel.</p>
    <button id="test-action" type="button">Run the planned interaction</button>
    <p id="result" aria-live="polite"></p>
  </main>

  <script>
    document.querySelector('#test-action').addEventListener('click', () => {
      document.querySelector('#result').textContent =
        'The planned interaction completed.';
    });
  </script>
  <script type="module" src="/rum.js"></script>
</body>
</html>
Emit aligned Web Vitals and navigation records
Create public/rum.js. The same page-view ID appears on records from one document visit, but a reload creates a new value. Transfer-size fields use an explicit finite-number check, so a legitimate numeric zero remains zero rather than becoming null.
import { onCLS, onINP, onLCP } from '/node_modules/web-vitals/dist/web-vitals.js';

const RUM_ENDPOINT = '/rum';
const pageViewId = crypto.randomUUID();

function meta(name, fallback) {
  return document.querySelector(`meta[name="${name}"]`)?.content || fallback;
}

function exposureType() {
  const loopbackHosts = new Set(['localhost', '127.0.0.1', '::1']);

  return loopbackHosts.has(window.location.hostname)
    ? 'local'
    : 'tunnel';
}

function routeGroup() {
  const path = window.location.pathname;

  if (path === '/') return 'landing';
  if (path.startsWith('/dashboard')) return 'dashboard';
  if (path.startsWith('/items/')) return 'item-detail';

  return 'other';
}

function viewportClass() {
  if (window.innerWidth < 600) return 'small';
  if (window.innerWidth < 1024) return 'medium';
  return 'large';
}

function browserFamily() {
  const ua = navigator.userAgent;

  if (/Firefox\//.test(ua)) return 'firefox';
  if (/Edg\/|Chrome\/|Chromium\//.test(ua)) return 'chromium';
  if (/Safari\//.test(ua) && !/Chrome\/|Chromium\//.test(ua)) {
    return 'safari';
  }

  return 'other';
}

function commonFields() {
  return {
    schemaVersion: 1,
    exposure: exposureType(),
    scenario: meta('rum-scenario', 'landing-load'),
    cacheState: meta('rum-cache-state', 'unknown'),
    build: meta('rum-build', 'unknown-build'),
    route: routeGroup(),
    browserFamily: browserFamily(),
    viewport: viewportClass(),
    network: meta('rum-network', 'unknown'),
    pageViewId,
    clientRecordedAt: new Date().toISOString()
  };
}

function sendRum(record) {
  const body = JSON.stringify({
    ...commonFields(),
    ...record
  });

  const payload = new Blob([body], {
    type: 'application/json'
  });

  const queued = navigator.sendBeacon(RUM_ENDPOINT, payload);

  if (!queued) {
    fetch(RUM_ENDPOINT, {
      method: 'POST',
      headers: {
        'Content-Type': 'application/json'
      },
      body,
      keepalive: true,
      credentials: 'same-origin'
    }).catch(() => {
      // Telemetry failure must not break the application.
    });
  }
}

function reportWebVital(metric) {
  sendRum({
    recordType: 'web-vital',
    metric: metric.name,
    value: metric.value,
    delta: metric.delta,
    rating: metric.rating,
    metricId: metric.id,
    navigationType: metric.navigationType
  });
}

onLCP(reportWebVital);
onCLS(reportWebVital);
onINP(reportWebVital);

function roundedDuration(value) {
  return Number.isFinite(value)
    ? Math.max(0, Math.round(value))
    : null;
}

function numericSizeOrNull(value) {
  return Number.isFinite(value)
    ? Math.max(0, Math.round(value))
    : null;
}

function reportNavigationTiming() {
  const navigation = performance.getEntriesByType('navigation')[0];

  if (!navigation) return;

  const tlsDuration =
    navigation.secureConnectionStart > 0
      ? navigation.connectEnd - navigation.secureConnectionStart
      : null;

  sendRum({
    recordType: 'navigation',
    navigationType: navigation.type,
    redirect: roundedDuration(
      navigation.redirectEnd - navigation.redirectStart
    ),
    dns: roundedDuration(
      navigation.domainLookupEnd - navigation.domainLookupStart
    ),
    connection: roundedDuration(
      navigation.connectEnd - navigation.connectStart
    ),
    tls: tlsDuration === null
      ? null
      : roundedDuration(tlsDuration),
    requestToFirstByte: roundedDuration(
      navigation.responseStart - navigation.requestStart
    ),
    responseDownload: roundedDuration(
      navigation.responseEnd - navigation.responseStart
    ),
    responseStartFromNavigation: roundedDuration(
      navigation.responseStart - navigation.startTime
    ),
    domInteractive: roundedDuration(
      navigation.domInteractive - navigation.startTime
    ),
    domContentLoaded: roundedDuration(
      navigation.domContentLoadedEventEnd - navigation.startTime
    ),
    loadEvent: roundedDuration(
      navigation.loadEventEnd - navigation.startTime
    ),
    transferSize: numericSizeOrNull(navigation.transferSize),
    encodedBodySize: numericSizeOrNull(navigation.encodedBodySize),
    decodedBodySize: numericSizeOrNull(navigation.decodedBodySize)
  });
}

window.addEventListener('load', () => {
  window.setTimeout(reportNavigationTiming, 0);
}, { once: true });
The example import references /node_modules/..., but the server does not expose that directory yet. Add the narrowly scoped route below before the general static middleware in server.mjs. Do not expose the complete project directory.
app.use(
  '/node_modules/web-vitals',
  express.static(path.join(__dirname, 'node_modules/web-vitals'))
);

app.use(express.static(path.join(__dirname, 'public')));
Replace the original single express.static line with those two lines while keeping requireBasicAuth before them. For a bundled application, import web-vitals through the project’s normal build pipeline instead.
The Navigation Timing field definitions follow the browser’s initial document navigation model. Consult the primary Navigation Timing Level 2 specification when interpreting boundaries such as requestStart, responseStart, and transfer sizes.
Start and verify the collector locally
Configure and start the application
Choose test-only credentials. Do not commit them to source control or place Localtonet device tokens in these variables.
BASIC_USER=rumtester \
BASIC_PASS='replace-with-a-long-test-password' \
ALLOWED_ORIGINS='http://localhost:3000' \
npm start
Open http://localhost:3000. The browser will request the Basic authentication credentials. After authentication, load the page, press the planned interaction button, and leave the page normally so eligible metric callbacks have an opportunity to report.
Verify the endpoint independently
This request submits one valid synthetic LCP record. It tests authentication, Origin handling, schema validation, and persistence without pretending to be a real browser measurement.
curl -i \
  -u 'rumtester:replace-with-a-long-test-password' \
  -H 'Origin: http://localhost:3000' \
  -H 'Content-Type: application/json' \
  --data '{
    "schemaVersion":1,
    "exposure":"local",
    "scenario":"landing-load",
    "cacheState":"cold",
    "build":"dev-build-1",
    "route":"landing",
    "browserFamily":"chromium",
    "viewport":"large",
    "network":"home-wifi",
    "pageViewId":"123e4567-e89b-42d3-a456-426614174000",
    "clientRecordedAt":"2026-01-15T12:00:00.000Z",
    "recordType":"web-vital",
    "metric":"LCP",
    "value":1400,
    "delta":1400,
    "rating":"good",
    "metricId":"verification-record",
    "navigationType":"navigate"
  }' \
  http://localhost:3000/rum
A successful request returns HTTP 204. Inspect data/rum.ndjson and confirm that the stored line starts with a server-generated serverReceivedAt. Remove the synthetic verification line before collecting the actual experiment, or use a distinct build label and exclude it during aggregation.
Validate failure behavior
- Remove the Authorization header and confirm the endpoint returns 401.
- Use an Origin not listed in
ALLOWED_ORIGINSand confirm it returns 403. - Add an unknown JSON field and confirm strict schema validation returns 400.
- Send malformed JSON and confirm it returns 400.
- Send a body larger than 16 KB and confirm it returns 413.
- Refresh repeatedly only within a safe test range and confirm rate-limit headers are present.
In browser developer tools, confirm that /rum requests are sent after the navigation record or metric callbacks occur. Then close heavy profiling panels before collecting comparison runs because detailed developer tooling can alter performance.
Expose the application with a Localtonet HTTP tunnel
Add the final public HTTPS origin to ALLOWED_ORIGINS and restart the Node.js application before collecting tunneled records. Origin matching is exact, including scheme and host. Do not use a wildcard for convenience.
The current documented HTTP tunnel workflow separates configuration from startup. Follow the sequence below and use the values currently shown in the dashboard. Available relay servers and regions must not be hardcoded from an old article.
Install and run the Localtonet application
Install the Localtonet client for the operating system on the device that can reach the Node.js service. Run the client and keep that device connected during the test.
Open the HTTP tunnel page
In the Localtonet dashboard, go to the HTTP tunnel workflow. Standard HTTP tunneling is distinct from VPN Manager and does not create a private VPN.
Select the process type
Choose Random Sub Domain, Custom Sub Domain, or Custom Domain as appropriate and available. All three process types serve the configured application through a public HTTPS address. Check current dashboard requirements before configuring a custom domain.
Select the AuthToken and server
Select the device-specific AuthToken for the client that will run the tunnel, then select a currently available server or region. Keep the token secret and obtain server choices from the current dashboard.
Enter the local IP address and port
Point the HTTP tunnel to the local target used by the application. For this reference project, the port is 3000 unless PORT was changed. Use an IP address reachable from the Localtonet client device.
Press Start
Start the tunnel and wait until it is running. Creating the tunnel configuration does not start it. The public address works only while the selected client is connected and the tunnel is running.
See our HTTP tunnel documentation alongside the current dashboard. After the public URL is assigned, restart the collector with both origins:
BASIC_USER=rumtester \
BASIC_PASS='replace-with-a-long-test-password' \
ALLOWED_ORIGINS='http://localhost:3000,https://your-assigned-public-host' \
npm start
Replace the placeholder with the exact assigned HTTPS origin and do not include a path or trailing slash. Open the public URL, authenticate, and verify that the same application build appears. Confirm that a stored record has "exposure":"tunnel". If the application is reached locally through a LAN hostname rather than loopback, replace hostname inference with an explicit server-provided exposure value.
An unlisted URL is not access control. Keep Basic authentication enabled, use test-only data, limit the exposure window, and do not send the Localtonet device token to browser code. Stop the tunnel when collection ends and delete it if the configuration is no longer needed.
Aggregate counts and percentiles for matching cohorts
Collect repeated local and tunneled visits using the same build, route, scenario, cache state, browser family, viewport, and network label. Alternate local and tunneled runs when practical so application warm-up and changing conditions do not always favor one side.
Create aggregate.mjs. This script filters to one matching cohort, converts web-vital and selected navigation records into comparable measurements, and reports count, P50, P75, and P90 separately for local and tunnel exposure. It uses the nearest-rank percentile method and does not interpolate values that were never observed.
import { readFile } from 'node:fs/promises';

const file = process.env.RUM_DATA_FILE || './data/rum.ndjson';

const filters = {
  scenario: process.env.SCENARIO || 'landing-load',
  cacheState: process.env.CACHE_STATE || 'cold',
  build: process.env.BUILD || 'dev-build-1',
  route: process.env.ROUTE || 'landing',
  browserFamily: process.env.BROWSER || 'chromium',
  viewport: process.env.VIEWPORT || 'large',
  network: process.env.NETWORK || 'home-wifi'
};

const raw = await readFile(file, 'utf8');

const records = raw
  .split('\n')
  .filter(Boolean)
  .map((line, index) => {
    try {
      return JSON.parse(line);
    } catch {
      throw new Error(`Invalid JSON on line ${index + 1}`);
    }
  })
  .filter((record) =>
    Object.entries(filters).every(
      ([key, expected]) => record[key] === expected
    )
  );

function measurementRows(record) {
  if (record.recordType === 'web-vital') {
    return [{
      exposure: record.exposure,
      measurement: record.metric,
      value: record.value
    }];
  }

  if (record.recordType === 'navigation') {
    return [
      ['requestToFirstByte', record.requestToFirstByte],
      ['responseDownload', record.responseDownload],
      ['responseStartFromNavigation', record.responseStartFromNavigation],
      ['domContentLoaded', record.domContentLoaded],
      ['loadEvent', record.loadEvent]
    ]
      .filter(([, value]) => Number.isFinite(value))
      .map(([measurement, value]) => ({
        exposure: record.exposure,
        measurement,
        value
      }));
  }

  return [];
}

function percentile(values, percentileValue) {
  if (values.length === 0) return null;

  const sorted = [...values].sort((a, b) => a - b);
  const rank = Math.ceil((percentileValue / 100) * sorted.length);
  const index = Math.max(0, rank - 1);

  return sorted[index];
}

const groups = new Map();

for (const row of records.flatMap(measurementRows)) {
  const key = `${row.measurement}|${row.exposure}`;

  if (!groups.has(key)) {
    groups.set(key, []);
  }

  groups.get(key).push(row.value);
}

const summary = [...groups.entries()]
  .map(([key, values]) => {
    const [measurement, exposure] = key.split('|');

    return {
      measurement,
      exposure,
      count: values.length,
      p50: percentile(values, 50),
      p75: percentile(values, 75),
      p90: percentile(values, 90)
    };
  })
  .sort((a, b) =>
    a.measurement.localeCompare(b.measurement) ||
    a.exposure.localeCompare(b.exposure)
  );

console.log('Matching cohort filters:');
console.table(filters);
console.table(summary);

for (const measurement of new Set(summary.map((row) => row.measurement))) {
  const local = summary.find(
    (row) => row.measurement === measurement && row.exposure === 'local'
  );
  const tunnel = summary.find(
    (row) => row.measurement === measurement && row.exposure === 'tunnel'
  );

  if (!local || !tunnel) continue;

  console.log(
    `${measurement}: P75 tunnel-local difference = ${tunnel.p75 - local.p75}`
  );
}
Run the report with explicit cohort values:
SCENARIO=landing-load \
CACHE_STATE=cold \
BUILD=dev-build-1 \
ROUTE=landing \
BROWSER=chromium \
VIEWPORT=large \
NETWORK=home-wifi \
npm run report
Review the count before interpreting any percentile. P75 is the standard framing for Core Web Vitals field assessment, but a P75 from a small predeployment sample should be described only as the sample’s P75. P90 is even less stable with few observations. Use a small test to detect obvious changes and validate instrumentation, not to claim population-level quality.
Interpret metric differences carefully
| Measurement | Primary question | What a tunneled change can mean |
|---|---|---|
| Request to first byte | How long after requesting the document does its response begin? | Additional path delay, application waiting, host contention, or a combination |
| Response download | How long does the document body take to arrive? | Payload size, throughput, congestion, or pauses in delivery |
| LCP | When does the largest visible content render? | Document delay, resource discovery, resource transfer, or render delay |
| CLS | How much unexpected layout movement occurs? | Asset arrival can affect timing, but page structure, dimensions, fonts, and dynamic content are common causes |
| INP | How responsive are qualifying interactions? | Main-thread work, event processing, presentation work, or a network-dependent interaction |
A local-versus-tunnel difference is not automatically “tunnel latency.” The public request includes the visitor’s access network, internet routing, Localtonet relay path, client connection, local application processing, and browser behavior. Navigation Timing does not assign each millisecond to an internal network hop.
Distinguish frontend, application, path, and network delays
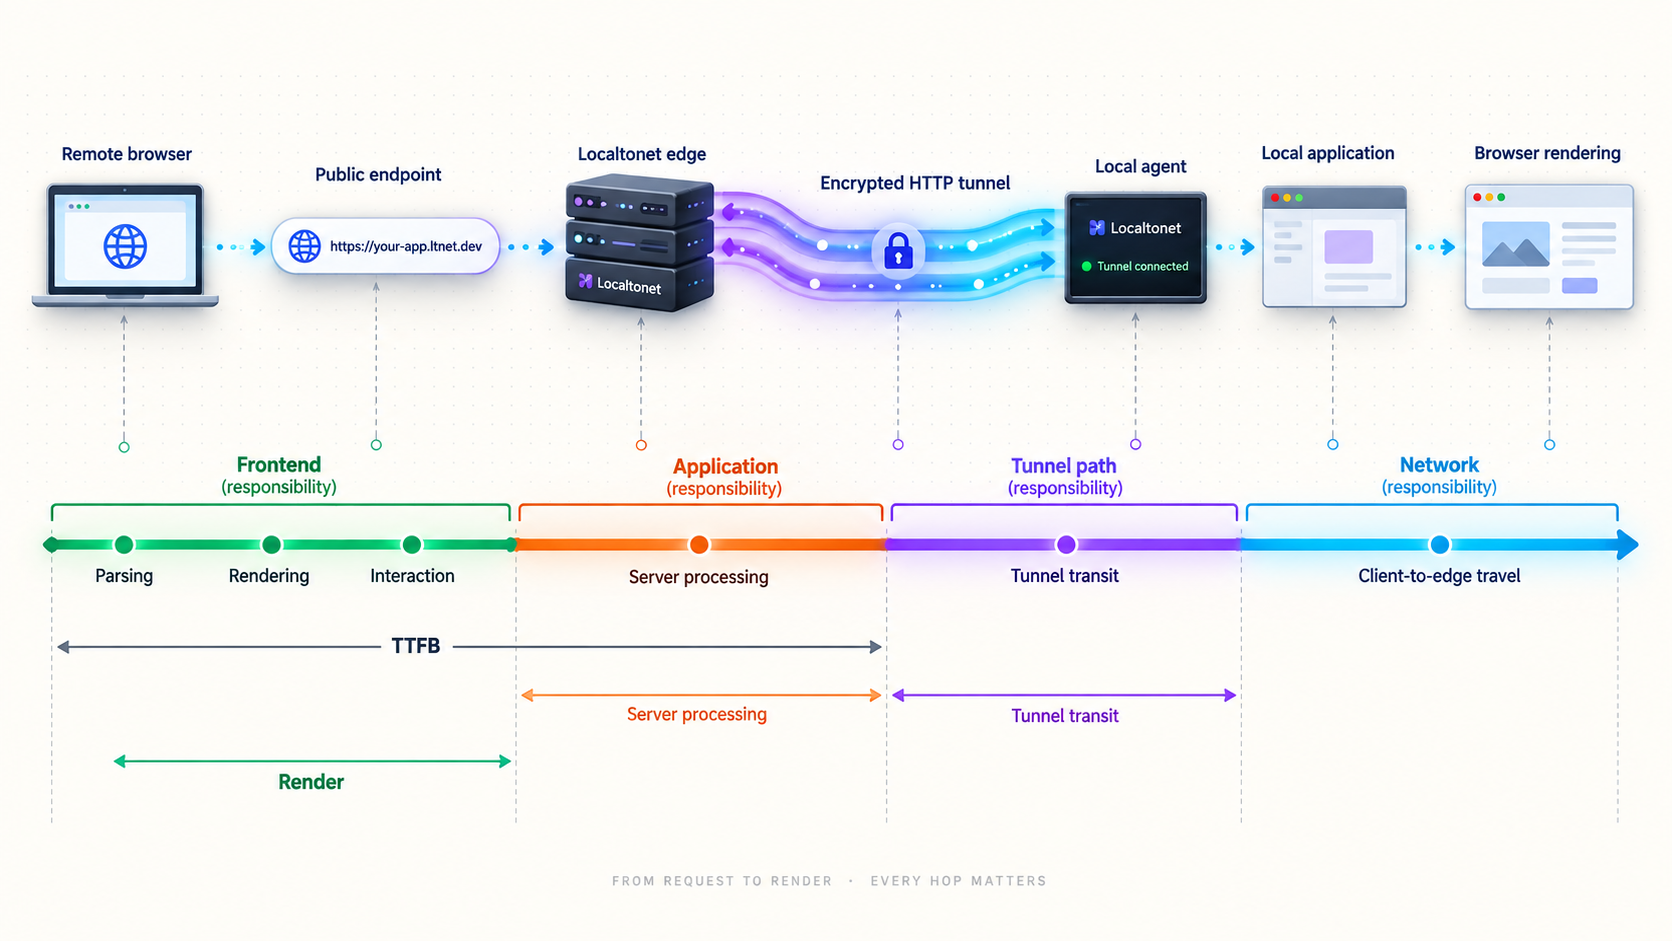
Performance diagnosis is strongest when the timeline is divided into stages. Core Web Vitals describe the user-visible outcome. Navigation Timing describes initial document delivery boundaries. Application telemetry can describe server processing. A browser trace can explain main-thread and rendering behavior in selected visits.
Break down a slow LCP
- Late document response: Examine request-to-first-byte timing, application processing, database calls, and host resource contention.
- Late resource discovery: Check whether JavaScript must execute before the browser discovers the main image, font, or content request.
- Long resource load: Inspect asset size, caching, throughput, prioritization, and competition among resources.
- Long render delay: Investigate main-thread work, styles, layout, hydration, decoding, and rendering dependencies.
If the tunneled document begins 180 milliseconds later but LCP is 900 milliseconds later, the path may explain part of the result but not necessarily all of it. A later document can also change resource scheduling or expose frontend work that was nearly invisible on localhost.
Break down a slow interaction
INP reflects qualifying interactions throughout the visit. Its underlying delay can be considered as input delay before the browser begins handling the event, processing time in event handlers and related JavaScript, and presentation delay before the next frame appears.
- High input delay commonly indicates that the main thread was already busy.
- High processing time points toward expensive handlers or synchronous JavaScript.
- High presentation delay suggests expensive style, layout, rendering, or painting work.
A page with no qualifying interaction may not produce INP. Missing INP is not zero and must not be counted as an instant interaction. Run the planned click, tap, or keyboard action consistently in both cohorts.
Watch the development host
Debug middleware, live reload, just-in-time compilation, verbose logging, database containers, and unrelated workloads can delay the local service. Record the application build and do not compare a development build with an optimized build as if only the access path changed.
If the application stack exposes server processing duration, add it under a separately validated schema. The short-lived page-view value can associate server and browser observations only if it is deliberately propagated. Do not replace it with an email address, account ID, access token, or another persistent identifier.
Use detailed traces after RUM finds a pattern
RUM identifies affected routes, scenarios, and browser segments. Use a browser performance trace for a few representative cases after the distribution shows a repeatable problem. A trace can explain one visit in depth, but one trace does not characterize the entire cohort.
RUM describes distributions and browser outcomes. Synthetic tests provide repeatability. Browser traces reveal main-thread details. Application telemetry measures server-side work. Combining them is more reliable than asking one measurement source to explain the complete path.
Protect the application and minimize test data
A useful performance record does not need to become a detailed record of user behavior. Collect only fields needed for the comparison, restrict the test to authorized participants, and define when the data will be deleted.
Understand the authentication boundary
The sample uses HTTP Basic authentication across the page, static module, and collector. The browser sends the cached authorization credentials to the same origin. Exact Origin validation is an additional control against cross-origin submissions. If your application uses cookies, retain Origin checks and integrate the endpoint with its established CSRF mechanism.
Never send a Localtonet AuthToken to browser code. That token identifies the client device that runs the tunnel. It is unrelated to application-user authentication and must remain private.
Keep fields coarse and controlled
- Use normalized route groups instead of complete URLs.
- Exclude query strings and fragments.
- Use a controlled scenario list rather than arbitrary tester text.
- Use coarse browser, viewport, and network categories.
- Do not collect form values, page text, cookies, or authorization headers.
- Do not store complete raw performance entries by default.
- Use server receipt time for ordering.
- Treat client time as optional context, not a trusted event clock.
- Keep the random page-view value short-lived and nonpersistent.
Separate test and production data
Populate the application with synthetic or sanitized records. Review email delivery, payments, background jobs, webhooks, analytics, and other side effects before inviting testers. A public tunnel should not become an accidental route to production customer information.
Clean up after the experiment
Stop the Localtonet tunnel after the scheduled test window and delete the tunnel if it is no longer needed. Stop the Node.js process, revoke the test credentials, remove the public origin from configuration, and archive or delete the telemetry according to the experiment’s retention plan.
rm -f data/rum.ndjsonRun the deletion command only after any approved report has been produced and only if the file path is correct for the test environment.
Passwords, tokens, cookies, authorization headers, private endpoints, complete request bodies, personal data, and arbitrary user-controlled text do not belong in RUM payloads.
Troubleshoot common collector and tunnel problems
The application works locally but not through the tunnel
Confirm that the Node.js service is running on the configured port. Verify that the Localtonet client is connected, the correct AuthToken device is selected, the local target is reachable from that device, and the tunnel was explicitly started. Creating a configuration does not run it.
Development servers can enforce allowed-host checks or generate absolute URLs for localhost. Resolve those behaviors through the application’s supported configuration rather than disabling validation globally.
The public page loads but telemetry receives 403
Compare the browser’s exact Origin with ALLOWED_ORIGINS. Include the https:// scheme and hostname, but no path or trailing slash. Restart the Node.js process after changing environment variables.
The browser cannot import web-vitals
Confirm that the narrowly scoped static route for /node_modules/web-vitals appears before the general public static route. Check the installed package contents if a future package release changes its browser distribution path. In an existing bundled application, use the bundler’s normal import { onCLS, onINP, onLCP } from 'web-vitals' workflow instead.
LCP or CLS arrives but INP does not
INP requires a qualifying interaction. Perform the same planned action during every relevant visit. The metric may also report or finalize later than loading metrics. Do not replace missing INP with zero or remove no-interaction visits without documenting the rule.
Some final beacons are missing
Beacon delivery is best effort. A queued beacon is not proof of persistence, and abrupt browser termination can lose telemetry. Report collector counts, tolerate missing records, and never make application behavior depend on successful telemetry delivery.
Navigation records exist only for the first page
The example measures the initial document navigation. Client-side route changes in a single-page application do not create another PerformanceNavigationTiming document entry. Soft-navigation measurement is browser and framework dependent and requires separate instrumentation. Keep landing-page and soft-navigation conclusions distinct.
Transfer size is zero
Zero can be a legitimate browser-reported value and may provide cache or transfer context. The reference code preserves it. A missing or nonnumeric value becomes null. Browser support, cache behavior, origin rules, protocol details, and privacy restrictions can affect these fields, so use them as supporting evidence rather than a universal truth.
The report shows only one exposure
Confirm that localhost visits use a recognized loopback hostname and tunneled visits use the public hostname. Check that both sets share the exact filter values supplied to the aggregation command. A mismatch in build, scenario, cache state, browser family, viewport, route, or network correctly places records outside the selected cohort.
Tunneled timings vary widely
Segment devices, networks, cache states, routes, builds, and browsers before looking for one cause. Check CPU, memory, compilation, database activity, and background tasks on the local host. Variation can be real, especially on mobile and shared wireless networks.
The public result is slower than localhost
A public route is longer than loopback, so some increase is unsurprising. Compare where the additional time appears. If request-to-first-byte grows while post-response rendering remains similar, delivery and application waiting deserve attention. If document timing changes little but LCP or INP worsens, inspect frontend execution and rendering. Do not attribute the full difference to Localtonet without supporting evidence.
Frequently asked questions
Can a localhost tunnel produce real Core Web Vitals?
Yes. Supported browsers can observe Core Web Vitals while loading an instrumented page through a public tunnel. The results describe those browser visits through that test path. They do not automatically represent a future production deployment or a broad user population.
What are the current good Core Web Vitals thresholds?
The good thresholds are LCP at or below 2.5 seconds, CLS at or below 0.1, and INP at or below 200 milliseconds. Population-level field assessment uses the 75th percentile framing. A small predeployment sample can use P75 descriptively, but it should not be presented as stable population evidence.
Does the local-versus-tunnel difference equal Localtonet latency?
No. The difference can include the browser’s access network, internet routing, relay path, client connection, local application processing, cache behavior, host contention, and frontend variation. Browser Navigation Timing does not isolate every internal hop.
Why is server receipt time preferred over the browser timestamp?
The collector controls its own receipt clock, so it is the more reliable ordering value for stored records. A browser clock may be inaccurate or manipulated. Client time can remain as optional context, but it should not be treated as trusted ingestion order.
Why can INP be missing?
INP requires a qualifying user interaction and supporting browser APIs. A page that receives no qualifying interaction may not produce an INP observation. Missing INP must remain missing rather than being converted to zero.
Does sendBeacon() guarantee that a record reaches the collector?
No. A successful return means the browser accepted the payload for queued delivery. It does not confirm that the collector received or stored it. Beacon telemetry must be treated as best effort, and the application must continue working when records are lost.
Does this example measure single-page application soft navigations?
No. Its Navigation Timing record describes the initial document navigation. Framework-level route changes require separate soft-navigation instrumentation. Keep landing-page performance and later client-side navigation performance in distinct scenarios.
How many visits are required before comparing percentiles?
There is no universal count for every experiment. Collect repeated matching observations, report the count beside each percentile, and avoid strong conclusions from small samples. Higher percentiles require more observations to become stable. Small tests are most useful for validating the workflow and finding obvious regressions.
Measure your local application through a controlled public path
Start with an authenticated localhost baseline, collect matching scenarios through a Localtonet HTTP tunnel, and compare counts and percentiles without overstating what the sample proves. Keep device tokens private, minimize telemetry, and stop the tunnel when the experiment is complete.
Get Started Free →